Urals at $62.60. Time to panic?

The Urals oil price -- the benchmark price for Russian crude oil exports to the west -- held resolutely above the cap limit of $60 / barrel all last week, closing at $62.60 on Friday.  Russia's eastern ESPO oil price also rallied, ending the week at $72, only $5 / barrel below the US West Texas Intermediate (WTI) benchmark.

​More interestingly, the Urals discount, the difference between the Urals and Brent oil prices, narrowed, closing the week around $18 / barrel.  The discount appears to narrow when Brent exceeds $80 / barrel.  This makes intuitive sense, as higher oil prices reflect greater bargaining power by sellers, including the Russians, which may cause the discount to narrow.  Put another way, when Brent is above $80, Urals may rise faster than Brent.

​Do last week's developments signal the collapse of the Price Cap?  Maybe not.  Urals stood above $60 for most of April, and then retreated back below the cap limit.  Therefore, to announce the death of the Price Cap would seem premature.  Still, the ESPO discount has been narrowing gradually since March, so the Price Cap on Urals may also become less binding over time.  

It is not yet time for panic, but concern is certainly warranted.

Rigs and Spreads July 21: Ugly

  • Rig counts

    • Total oil rig counts declined, -3 to 534

    • Horizontal oil rig counts fell, -4 to 483

    • The Permian horizontal oil rig count was down, -3.  The Permian has been losing rigs and a fair pace for the last two months.

  • The horizontal oil rig count fell at a pace of -3.25 / week on a 4 wma basis.

    • This number has been negative for 32 of the last 33 weeks

  • Frac spreads rose, +11 to 274.  This is not sustainable.

    • DUC inventory has fallen below 15 weeks for the first time, 14.7 weeks today

    • In order to hold DUC counts constant, horizontal rigs would have to rise by 68 or frac spreads would have to fall 34.

  • The EIA issued the July DPR this week.  Highlights:

    • Crude and condensate production from key shale plays rose in June to 9.23 mbpd, up 36 kbpd from May

    • Permian production was up 11 kbpd in June.  Permian production growth has averaged 12 kbpd / month over the last three months

    • The Permian is really slowing down; growth is being sustained by the Bakken, with support from the other secondary plays

    • Compared to last year, total shale oil production is up 0.7 mbpd; the Permian is up 0.5 mbpd

  • Production is being sustained in part by the cannibalization of the DUC inventory

Urals breaks through the $60 cap

Russian Oil Production

The EIA issued its estimates for Russian oil production this past week. The EIA is the statistics arm of the US Department of Energy.  It issues a large number of reports, including its monthly Short Term Energy Outlook, which is one of the wonders of the analytical world and the source of data on the graph below.  

The EIA reports that Russian oil production fell to 10.5 mbpd in June, a bit below earlier estimates and 7% below its pre-war level.  This is also 11% below EIA's pre-war forecast for Russian oil output, which in fact is similar to observed reductions in other prohibitions.  For example, in the Prohibition of the 1920s, per capita US alcohol consumption fell by 15%.  Prohibitions, including price caps and embargoes, are almost universally unsuccessful, a theme to which I regularly return in these analyses.  For now, the EIA sees Russia's June oil production as the low point going forward.  I think it fair to say that the EIA has low confidence in its forecast, but in any event, it anticipates no further reductions in Russian oil output.

Russian Crude Oil Prices

Russian crude oil prices are generally linked to its Urals oil price to the west and the ESPO (Eastern Siberia–Pacific Ocean oil pipeline​) price to the east.  Historically, both the Urals and ESPO prices were essentially indistinguishable from the European benchmark Brent oil price, at most with a discount of $1-2 / barrel.  Since the start of the war, ​however, ​the Urals and ESPO prices have diverged from Brent​ by as much as $35 / barrel​.  

A price cap of $60 / barrel was implemented by Ukraine's western allies on December 5th.  Since that time, the Urals price has generally remained below the cap threshold.  By contrast, the ESPO price has never fallen to or below the cap level.

The last reported price for Urals was $60.06 / barrel, that is, above the cap level.  This is not the first time this has occurred, as the posted Urals price was above the cap for most of April.

​Russian Oil Price Discounts

Russian oil prices can also be viewed in relation to Brent.  The Urals discount -- the difference between the Urals and Brent oil prices -- now stands at just under $20 / barrel, where it has been since mid-April.  Note that the Urals discount is effectively the smallest since the start of the war and smaller than before the imposition of either the embargo or price cap.   This is similarly true for the ESPO discount (the difference between the ESPO and Brent oil prices).

This suggests that the discount, rather than the price cap, is gating the Urals oil price.  That is, if Brent rises, the Urals price will follow at a distance of $20 / barrel.  Brent is just above $80, and the Urals is just above $60.  If Brent moves to $90, then Urals may be plausibly expected to rise to $70.  ​

​Of course, the western allies can move to sanction Greek shippers and Indian oil refineries for price cap breaches, but this comes at a political cost.  Further, the higher the Brent oil price, the less political leverage the western powers will enjoy.  

Forecasting oil prices is a hazardous occupation, but oil demand is expected to outstrip supply for the balance of the year and into 2024.  Higher Brent prices are certainly possible.

Urals today stands at $60 and ESPO above $71, implying an aggregate selling price around $63 / barrel for Russian crude oil exports.  ​​The Urals and ESPO oil prices averaged $56 / barrel from 2015 to 2021.  Current Russian selling prices are therefore already above the prior seven years' average.  If Brent moved up to, say, $100 / barrel, Russia's finances could improve quickly and materially.

​The price cap and embargo as currently implemented are misspecified and counter-productive.  ​Chinese and Indian interests are capturing the value of the Urals oil price discount, which in turn serves as 'store credits' for Russia to purchase influence and physical goods.  Put another way, the price cap is channeling funds into the Chinese military industrial complex when, were the cap properly structured, those funds would go in significant part to the US defense industry.  We are speaking of billions of dollars.

EIA PSR Week of June 7: Peak Oil in April?

  • This week’s data is distorted by the July 4th holiday and so not too much should be read into it

  • Nevertheless, excess crude inventories, as measured by seasonally-adjusted days of turnover, have been rising for the last five weeks, up 23 mb during that stretch

  • Product inventories were up, no doubt because tank trucks were not moving on the 3rd and 4th to deliver fuel to retailers

  • Product supplied (consumption) was off this week, again no doubt due to the holiday (ie, product supplied measures wholesale deliveries to retail gas stations, not fuel sales to consumers)

  • Oil prices have firmed

    • WTI stands around $75 with Brent at $80

    • Our Incentive to Store analysis sees slightly tighter balances going forward, but nothing unusual

  • The EIA has both reduced expectations for prospective world oil supply and raised demand expectations by about -0.5 and +0.1 mbpd respectively.  With this, excess crude balances look to head downward from around 600 mb currently to nearer 400 mb a year from now.  

    • This development should be considered constructive for oil prices, but still represents high levels of excess crude, perhaps consistent with $90 Brent, but on paper, not $110 Brent

Of greater interest is the EIA’s forecast for US crude and condensate production, with the graph below showing C+C production from the Lower 48 continental states (which excludes the Gulf of Mexico offshore and Alaska).  Most L48 production is shale oil.

  • L48 supply growth in H1 2023 comfortably exceeded earlier EIA expectations, but in fact supply peaked in April and has been declining every month since, down 200 kbpd through June.

  • The EIA sees this trend bottoming and turning back up from July.  

  • This is a bit hard to understand, given that rig counts have been declining for seven months and frac spreads are unchanged in more than a year.

  • In any case, the EIA now sees April 2023 as the expected peak for US C+C production through year-end 2024

Rigs and Spreads July 7: Rolling off

Last time, I wrote

Declining rig counts and rising spreads are an unsustainable combination at current levels.  This will lead to an accelerating erosion of DUC inventories, which have continued to fall almost without exception for the last three years.
Rebalancing the rig / spread ratio to hold DUC inventories constant would require either 62 additional horizontal rigs or a reduction in the spread count by 31.  Given that rigs have been in secular decline for the last half year and given that the breakeven to add rigs appears to require $80 / barrel WTI, it is hard to see a robust rig count recovery at current WTI oil prices below $70 / barrel.  The other alternative is a decline in spread counts, probably accompanied by a continued roll off in DUC inventories.  

We see just this development this week: another fall in rig counts and an even larger pro rata decline in the number of spreads.

*****

  • Rig counts

    • Total oil rig counts declined, -5 to 540

    • Horizontal oil rig counts fell, -6 to 489

    • The Permian horizontal oil rig count was down, -5

    • The rig count has fallen by 83 (15%) since its November peak, and stands at the level of April 2022

  • The horizontal oil rig count fell at a pace of -3.25 / week on a 4 wma basis.

    • This number has been negative for 30 of the last 31 weeks

  • Frac spreads fell, -12 to 260.  This is not the recent low, but pretty close

  • Where does all this turn around?

    • We are seeing a cyclical type of downturn in the rig count, the sort normally associated with recessions or over-production and resulting soft oil prices

    • But that’s not the story today.  US crude oil inventories are normal, the economy continues to expand at a reasonable pace, and oil prices are not particularly soft at nearly $74 / barrel WTI

    • How much do prices have to rise to stimulate a revival in drilling?  Or does that occur at any price?  

    • Is the reality that operators have simply drilled through their best inventory, that shales are a kind of one-trick pony, a comparative flash in the pan?  

    • This seems to be the case.  It is hard to avoid the impression that some kind of implosion is coming, a substantially more severe collapse of US shale oil production than is currently anticipated for the back half of this decade.

Rigs and Spread July 7.pdf

EIA PSR Week of June 30: Chugging along, with signs of life in aviation

  • Excess crude inventories, as measured by seasonally-adjusted days of turnover, have been rising, up 4 mb to 22 mb

  • Product inventories on a seasonally adjusted days of turnover basis fell 5 to -11 mb

  • Crude and key product inventories, taken together, are down marginally to +9 mb.  

  • SPR draws continue at 208 kbpd this past week.

  • Except jet fuel, demand remains range-bound

    • Gasoline demand is 3.3% below normal

    • Distillate had a bad week, but primarily due to base year effects

    • Jet fuel has its best week since the start of the pandemic, down only 3.4% below normal after averaging 10% below normal since the start of the year

  • US crude and condensate production has been bouncing around in the low 12s, 12.4 mbpd this past week, supporting the notion that US oil production has peaked

  • Oil prices remain range-bound, as they have since the beginning of May

    • WTI stands around $72 with Brent at $77, in fact their average price over the last twelve weeks

    • Our Incentive to Store analysis suggests that the market anticipates normal balances for the rest of the year, essentially a business-as-normal scenario, notwithstanding mooted Saudi production cuts

  • Finally, it is hard to avoid the impression that the Ukraine war has adversely affected US oil consumption.  

    • Gasoline consumption is about 4% lower than immediately prior to the war

    • Distillate consumption is off more than 10% compared to the pre-war period.

June Oil Price Cap: Largely Unchanged

Brent has languished in the mid-$70s since early May, notwithstanding Saudi production cuts.  China's economy looks increasingly suspect, and the world has plenty of excess crude inventories at present.  The Urals oil price, the price Russia receives for its exports to the west, has similarly languished in the mid-$50s / barrel, latest at $56.35 / barrel and under the $60 cap threshold.

The Urals discount, the difference between the Urals and Brent oil prices, has also remained largely unchanged, latest at just under $20 / barrel.  The discount, as before, remains smaller than before either the EU oil embargo or the price cap took effect.  

Rigs and Spreads June 23: Something bad this way comes

  • Rig counts fell this week, as has become customary

    • Total oil rig counts declined, -6 to 556

    • Horizontal oil rig counts fell, -2 to 496

    • The Permian horizontal oil rig count was down, -2

    • The rig count has fallen by 76 (13%) since its November peak and stands at the level of April 2022

  • The horizontal oil rig count fell at a pace of -5.25 / week on a 4 wma basis.  

    • This number has been negative for 28 of the last 29 weeks

  • Frac spreads rose, +9 to 277, up 21 in just the last three weeks

  • The EIA published the June DPR this past week.  Highlights:

    • In the June DPR report, crude and condensate production from key shale plays rose to 9.14 mbpd, up 48 kbpd from April

    • Permian production was up 9 kbpd in May.  Permian production growth has averaged 24 kbpd / month over the last three months

    • The EIA revised up production from key shale plays going back to November 2021, with revisions averaging a hefty 85 kbpd since the start of the year.

    • Compared to last year, total shale oil production is up 0.7 mbpd, of which the Permian contributed  0.5 mbpd. On paper, this is still decent growth at the annual horizon

  • Not all is happy, however

    • Permian oil production is effectively unchanged in the last four months

    • Shale oil production gains from the last two months have come from the minor plays.  Of these, only the Anadarko is showing secular growth.  The rest – the Niobrara, the Bakken and the Eagle Ford – are just revisiting production levels of late last year.  

    • Declining rig counts and rising spreads are an unsustainable combination at current levels.  This will lead to an accelerating erosion of DUC inventories, which have continued to fall almost without exception for the last three years.

      • Rebalancing the rig / spread ratio to hold DUC inventories constant would require either 62 additional horizontal rigs or a reduction in the spread count by 31.  Given that rigs have been in secular decline for the last half year and given that the breakeven to add rigs appears to require $80 / barrel WTI, it is hard to see a robust rig count recovery at current WTI oil prices below $70 / barrel.  

      • The other alternative is a decline in spread counts, probably accompanied by a continued roll off in DUC inventories.  

    • None of this bodes well for the future of US shale production.

Rigs and Spreads June 23.pdf

May Russia Oil Price Cap: Failing, as Dangers Rise

Last month I wrote that "not everyone believes" the EIA's estimate for Russia's April oil production, and in fact, the EIA has revised up Russia's oil production to 10.71 mbpd, 0.2 mbpd higher than its prior estimate for April.

The EIA reports Russian oil production falling in May by 0.1 mbpd to 10.63 mbpd, but that estimate may also prove too conservative.  Russia no longer publishes oil production statistics, so firm numbers are hard to come by.  Notwithstanding, MarineLink reports that Russia's seaborne oil exports from its western ports hit a 4-year record of 2.4 million barrels per day (mbpd) in May.  In the first quarter, Russia's gasoline exports were up 37% over the same period in 2022.  Russia’s exports suggest high levels of oil production in that country.

Fig. 1

Source: EIA, Princeton Energy Advisors

In terms of oil prices, the situation has not changed much since our last report.  Despite Saudi production cuts, Brent continues to languish, falling back to $75 / barrel at writing.  As a result, Russia's Urals oil price also remains below the $60 / barrel cap, although, as before, Russia's eastern ESPO oil price remains above the cap threshold, standing at nearly $66 / barrel at week end.

Fig. 2

Source: Bloomberg, OilPrice.com, PPA

The Urals discount -- the difference between the Urals and Brent oil prices -- widened a bit this week to $21 / barrel on average.  Notwithstanding, the Urals discount is now smaller than before the price cap was implemented, leaving the impression that the price cap today is wholly ineffective.

Fig. 3

Source: Bloomberg, OilPrice.com, PPA analysis

The rationale for the Saudi production cut of this past week and its almost immediate failure warrants a brief digression. This requires a technical explanation of the concept of excess inventories, for which I apologize up front.

A typical US refinery will normally hold 25 days of crude oil in inventory for day-to-day operations. For example, if a refinery were processing 1 million barrels per day (mbpd) of crude oil, we would expect it to hold 25 million barrels (mb) of crude in inventory. Inventories above this level are excess, in the sense that refiners and traders would normally be incentivized to run these inventories down to normal operating levels. If our hypothetical refinery had 30 mb of crude inventory but needed only 25 mb, we could say that 5 mb were excess.

We can also model this on a global scale, with the EIA providing both historical and forecast inventory levels. If we run the numbers, we can see that excess crude inventories have grown from 330 million barrels (mb) at the beginning of the war to 630 mb today. That's a big number. Running off current excess inventories could take more than a year, and possibly two.

Fig. 4

Source: EIA, PPA analysis

Excess inventories have been accumulating because global oil demand, particularly from China, was unexpectedly weak in the first half of the year.  Further, the EIA and other analysts expected Russian supply to be pulled from the market, and that clearly has not happened.  Indeed, it is reasonable to assume that Russia is pumping oil as fast as it can to sate its hunger for cash.  This is typical of state-owned producers operating in cartels like OPEC.  Private companies like Exxon or Shell produce more oil when prices are high and cut production when prices are low.  OPEC does exactly the opposite.  When prices are low, cartel members need more cash to balance their national budgets and therefore produce more oil, thereby depressing already weak oil prices.  When prices are high, OPEC tends to be slow to add capacity in order to maximize selling prices per barrel.  Russia appears to be acting as OPEC does in similar situations, that is, maximizing production to maximize revenue in a weak oil price environment given its wartime needs.

The EIA has revised its global oil demand forecast upward and global supply downward following the recently announced Saudi production cut.  Nevertheless, these revisions offer no more than the prospect of a balanced market.  That is, without Saudi production cuts, excess inventory would have continued to accumulate, pushing prices down even further.  If we accept the EIA's estimates of global balances and its forecasts for global oil supply and demand as plausible -- and I do -- then oil prices should remain reasonably soft, largely in the recent price range, for the balance of the year.  In other words, oil prices remain soft because the world has massive excess crude oil inventories.

This is largely good news for Ukraine, as oil prices seem on track to remain muted, thereby depriving Russia of much needed cash.  

On the other hand, the structure of both the embargo and price cap remain dreadful.  The Urals and ESPO price discounts are clearly being converted into 'store credits' which Russia can and is using to buy influence and actual goods and services.  Chechen strongman Ramzan Kadyrov showed footage of "new vehicles purchased for Chechen units participating in the SMO".  These are China Tigers, armoured personnel carriers, produced by Shaanxi Baoji Special Vehicles Manufacturing, a north China military contractor.  Moscow is no doubt the indirect purchaser. But with what?  The Urals discount provides leverage and a source of funds for Moscow to purchase Chinese arms.  The price cap and embargo, as currently structured, are a significant factor in drawing China into the conflict.  It's not just an alliance of like-minded autocrats. There's also money in it.

Fig. 5 China Tiger APV

Now imagine that Russian oil sanctions were manifest in a legalize-and-tax system allowing the western powers to capture the value of the Urals discount and give it to Kyiv.  Properly run, such a program would generate $4.5 bn / month for the war effort.  

Consider: On June 6, the Russians blew up the Kakhovka Hydroelectric Power Plant.   Ihor Syrota, head of Ukraine's state-owned energy company Ukrhydroenergo, was quoted in the Kyiv Independent as saying that reconstruction will take at least five years and $1 billion.  If the Urals discount were captured by the western allies and provided to Ukraine, the Kakhovka dam could be rebuilt with one week's cash flow.  And the contract could be offered to China.  This would give Beijing a reason to take a positive view of Kyiv and refrain from leaning excessively towards the Russian side.  

As currently constructed, the price cap and embargo are creating a coalition of countries with a financial interest in perpetuating the conflict and acceding to Russia's requests.  Take that money away, give it to Ukraine, and Russia's international support will quickly fade, as will the appetite of Russia and China to prolong the war.

Rigs and Spreads June 2: Plummeting


  • Rigs counts fell sharply -- again

    • Total oil rig counts declined, -15 to 555

    • Horizontal oil rig counts fell, -14 to 502

    • The Permian horizontal oil rig count was down 4

    • The rig count has fallen by 50 (9%) since March alone, and stands at the level of April 2022

  • The pace of horizontal rig additions fell an eye-opening 8.25 / week on a 4 wma basis.  

    • This number has been negative for 25 of the last 26 weeks

  • Frac spreads were -4 to 256, a level last seen in September 2021

    • Spread counts are down 38 (13%) in just the last six weeks

  • Overall, the picture looks reasonably grim

    • Both rig and spread counts continue to roll off, sharply in the last few weeks

    • The implied breakevens are well above $80 / barrel WTI

  • Until we see technological innovation at scale such as Exxon has floated, the shale sector could be headed for a rough patch indeed


EIA PSR Week of May 26th: Party on

  • Excess crude inventories, as measured by seasonally-adjusted days of turnover, fell 2 mb this week to 5 mb.  There is materially no excess crude inventory and trends are constructive overall.

  • Product inventories on a seasonally adjusted days of turnover basis fell 4 to -7 mb

  • Crude and key product inventories, taken together, are down 5 mb to -6 mb.  Overall, crude and key product inventories together are a bit tight, supportive of prices around the $80 WTI range

  • SPR draws continue at 360 kbpd this past week.

  • Demand continues to hang in there

    • Gasoline demand is 2% below normal, but about the best this year on relative terms

    • Distillate is normal, and again about the best in relative terms this year

    • Jet fuel remains 9% below normal, but showing a gradual normalizing trend

  • US crude and condensate production fell by 0.1 mbpd to 12.2 mbpd, unchanged in the last six months

    • US oil production has peaked

  • Oil prices have tanked once again

    • Once again, this panic is unsupported by incoming US data.  By implication, though, China is struggling, which is also much discussed in the press

  • As have been typical in recent months, both recessionary and expansionary signals are evident in the economy, and it is not clear which will dominate.  As far as the US weekly oil data is concerned, however, the party is still on.

Rigs and Spreads May 19: Unraveling

  • Rigs counts fell sharply

    • Total oil rig counts declined, -11 to 575, no higher than the level of last June

    • Horizontal oil rig counts fell, -10 at 522, here too back to June 2022 levels

    • The Permian horizontal oil rig count was down 4

    • Our model suggests continued falls in general, although next week could see a technical rebound, given this week’s steep decline

  • The pace of horizontal rig additions fell to a whopping -5.75 / week on a 4 wma basis.  

    • This number has been negative for 23 of the last 24 weeks

  • Frac spreads were -10 to 262, a level no higher than November 2021

  • Overall, the picture looks increasingly like secular decline

    • In the Permian, rig counts remain flat, essentially unchanged since last summer

      • As we noted last week, Permian production growth is slowing steadily and the Permian supply could peak as soon as Q3, and most likely within a year

      • Permian production growth has been maintained by the cannibalization of the play’s DUC inventory, down by an eye-opening one-third over the last year.  

      • At present, the Permian has only 7.8 weeks of DUC inventory at hand, a record low for the play and suggestive of a material lack of promising drilling prospects

    • In the other plays (all excluding the Permian), the rig count has been falling, although oil production has remained relatively steady

      • Given falling rig counts in these plays, their oil production may begin to slip off recent levels by, say, Q4 or early next year

April Embargo and Oil Price Cap: More Failure

Russian Oil Production

The EIA published Russian oil production numbers for April, and for a change, they have come in at the EIA's expectations, that is, a decline of 350,000 bpd to 10.51 mbpd, down 7.3% compared to Russia's pre-war production.

​Now, this would appear to be good news, but alas, not everyone believes it.  ​Market Insider reports that, in the four-week stretch to May 5, Russia's "seaborne crude flows reached 3.55 million barrels a day, the highest mark since Bloomberg began tracking the data in early 2022.   The rising seaborne exports continue a trend that was seen throughout March and April."

Given that Russia in February had ostensibly committed to reducing production by 500,000 bpd during March, resurgent exports have prompted skepticism from industry analysts.  Russia has classified or delayed key statistics, including on oil production.  Consequently, booming sea-borne exports of Russian oil and healthy refining volumes at home have prompted questions over whether Russia was indeed cutting its oil production.  Under the circumstances, Russia's Deputy Energy Minister Pavel Sorokin felt compelled to hold a call with Western analysts, trying to convince them that Russia had reduced output as targeted.  Reuters notes that the call was probably the first since early 2022.  If Russians need to arrange a rare analyst call to convince the market that they are not cheating and lying, it is probably safe to assume that they are.

Nevertheless, according to Bloomberg, the number of idled oil wells in Russia rose to 18.1% of the total in March. Perhaps the Russians are cutting production after all, although the US could cut producing wells by 20% -- old stripper wells producing at most a few barrels per day -- without reducing output by more than a few percent.   Time will tell.

Nearly all of Russia's crude exports were sent to China and India over the last month, and volumes to Asia also moved to a new high.  China and India bought about 1.5 million barrels a day, according to Kpler data, and Turkey and Bulgaria were also top buyers.

So much for the embargo.

Oil Prices
Oil prices have languished in recent weeks, with Brent hovering in the mid-$70s.  This in turn has translated into weaker Russian oil prices since mid-April, with Russia's benchmark Urals price returning below the $60 cap to around $56 / barrel.  

​Nevertheless, ​the Urals Discount -- the difference between the Urals and Brent oil prices -- remains smaller than before the implementation of the Price Cap or the Embargo.  Perhaps the Discount will widen again, but it looks like the Russians have found a way around it.  I would expect the Discount to shrink again, particularly if oil prices strengthen.  

​Overall, both oil pricing and trends in discounts were mildly unfavorable to Russia this week.

Russia's Budget

Oilprice.com notes that the Russian state is starting to accumulate financial reserves again.  Speaking to Bloomberg, Natalia Milchakova, an analyst at Freedom Holding Corp., added that “this may even positively affect the ruble.”

Part of the reason for the recovery of oil revenues to the state budget is a tax hike.  The government's take is based on an officially determined discount for Urals to Brent crude, which was set at $34 / barrel for last month. However, going forward, the base will be a narrowed discount to Brent, reaching $25 per barrel for July.  According to the Russian Finance Ministry, the change in the formula could bring an additional $7.46 billion (600 billion rubles) into the federal budget.  As a result, Moscow will likely begin buying foreign currency for its sovereign wealth fund again, with analysts expecting the purchases to begin in June and focus on the Chinese yuan.

In other words, continued elevated volumes of oil production, a trend towards a closing Urals discount, and a higher tax rate may allow Moscow to once again run a 'profit' on the war, in the sense of being able to accumulate, rather than draw, reserves.

So much for the Price Cap.

Conclusion

We have stated, for more than a year, that the Embargo and Price Cap would be failures, and the incoming data are consistent with our views.  Given that former President Trump on CNN called for a reduced commitment to Ukraine were he to be re-elected, it is high time for the Ukrainians to take a more proactive role in the matter of Russia's oil export revenues.

EIA PSR Week of April 28: Panic at the Disco

  • Crude inventories declined again this week

    • Excess crude inventories, as measured by seasonally-adjusted days of turnover, have fallen by 39 mb since early March, now only 13 mb

  • Product inventories are normal

    • Crude and key product inventories, taken together, are up 7 mb to 10 mb this week, as measured by seasonally-adjusted days of turnover terms.

  • SPR draws continue at 290 kbpd this past week.  Why?

  • Refined products supplied was softer this week, with gasoline down but diesel holding up

    • There is still no recessionary signal in the US data today, although this week’s consumption (supplied) data was a bit light

  • US crude and condensate production rose by 0.1 mbpd to 12.3 mbpd, materially unchanged in the last ten months

  • Oil prices have tanked

    • This is pure financial panic

    • The futures curve continues to signal normal balances going forward

    • Panics can resolve organically. Or they can be a harbinger of a pending financial crisis.  Take your pick.

DOE Week of April 21st: Oddly weak oil prices

  • Crude inventories declined this week

    • Excess crude inventories, as measured by seasonally-adjusted days of turnover, have fallen by 26 mb since early March, now only 16 mb

  • Product inventories are normal

  • Crude and key product inventories, taken together, have fallen by 30 mb since early March as measured by seasonally-adjusted days of turnover, and now stand at only 3 mb, which is effectively nothing in practical terms.

  • SPR draws continue at a pace of 150 kbpd this past week

  • Total, diesel, gasoline, and jet fuel supplied (consumption) all look good by recent comparisons, particularly jet fuel and diesel (distillate)

    • There is no recessionary signal in the US data today

  • US crude and condensate production fell by 0.1 mbpd to 12.2 mbpd, materially unchanged in the last ten months

  • Oil prices have fallen back despite OPEC production cuts

    • Oil prices have a distinct recessionary feel.  Flat US oil production, OPEC production cuts, solid US oil demand and ostensibly recovering Chinese demand should be notably bullish for oil prices

    • Clearly, this is not the case and suggests weakness either in the financial demand for oil futures or weak physical demand for crude oil

    • Notwithstanding, our incentive to store analysis continues to show normal supply/demand balances for crude oil into the second half of the year, which should be constructive for oil prices

    • Perhaps tepid pricing is merely a passing blip, but it could also represent a financial crisis in the works or a Chinese economy not as strong as commonly thought

The Oil Price Cap: Continued Collapse of the Discount

Last time, I noted that the Urals oil price had breached the $60 / barrel price cap, and moreover, that the Urals discount was shrinking.  The situation has deteriorated further over the last week.

Let's start with oil prices.  Brent eased back a bit this week to the range it has been holding for most of the year.  On Friday it closed at $81.66. Not much news here, save that OPEC's production cuts have not produced visible results to date.

​On the other hand, the Urals oil price, the price Russia receives for its crude oil exports to the country’s west, has settled in the mid-$60s, latest at $65.44 / barrel. This is well above the $60 / barrel price cap dictated by the western powers.  Thus, Russia has not only broken through the cap limit, but also sustained the Urals price above the cap level.

The news on the Urals discount is substantially worse.  As readers will recall, the Urals discount is the difference between the Brent oil price, the benchmark for Europe; and the Urals price, the benchmark for Russian western crude exports.  This discount is closing with screaming speed, now only $16 / barrel, the smallest since the start of the war.  The Oil Price Cap is not only failing, it is failing spectacularly.  

Meanwhile, efforts are beginning to try to salvage the program.  The Poles want stricter enforcement of the Price Cap, and Bloomberg reports that a tanker company, Gatik Ship Management, had "lost industry standard insurance for its fleet after falling foul of a Group of Seven price cap".  Gatik is a shadowy company with nominal headquarters in Mumbai, India.  Bloomberg elaborates:

Gatik is one of a handful of tanker companies that sprang up out of nowhere when the west began ratcheting up sanctions on Moscow last year.  When Bloomberg visited the address earlier this year, a person from a neighboring office said Gatik had moved out and there was mail strewn on the floor outside. There is no website, phone number, or other means of contacting the firm.

The company operates a fleet of 48 Aframax tankers, the type used for Russia crude exports.  

So what happens next?  Well, it is reasonably safe to assume that Gatik's vessels will be sold or otherwise transferred to a new, similarly shadowy company, which we may call Gatique (no relation!) with headquarters, say, two blocks from Gatik.  This new company will obtain maritime insurance, and after a few months will be deemed in violation of the Price Cap, after which the vessels will be sold to a company which we may call Batik, and so on.  

Prohibitions, price caps and resulting black markets inevitably devolve into games of Whac-A-Mole (here, for my Ukrainian readers).  The only surprise is the unending naivete of the US Treasury, which, again according to Bloomberg, "warned that some oil tankers shipping Russian crude in Asia are using deceptive tactics to evade the Washington-led price cap on the country’s exports."  Goodness, who knew?

If you were a Ukrainian policy-maker, you might assume that the system should be self-correcting, that the US government would eventually modify the Price Cap incorporating black market theory. Not at all. The history of prohibitions shows only two government responses, either tacit acceptance of black markets or doubling down on enforcement. Neither produces good results, and both represent a material threat to Ukraine, particularly in the post-war world.

If the Ukrainians fail to ask for a change, the current Oil Price Cap will continue in some form indefinitely, an on-going game of Whac-a-Mole, sometimes bringing a rush of enforcement and, at others, feigned ignorance and tacit acceptance of Russian oil smuggling. Both approaches will fail, just as the current Price Cap is failing.

All this is likely to continue until the Ukrainians stand up and request a better system. Unfortunately, the Ukrainians are mired in passivity. The Ukrainian Embassy in DC has had our exposition on the topic for an entire year now, and they have done exactly nothing with it.  The sooner the Ukrainians wake up and take responsibility for the success of Russian oil sanctions, the sooner the matter will be addressed to Kyiv’s satisfaction.

Rigs and Spreads Apr. 21: DUCs continue to decline

  • Rigs counts gained

    • Total oil rig counts rose for a change, +3 to 591, but are still below their level of last June

    • Horizontal oil rig counts were +3 at 543, no higher than last July

    • The Permian horizontal oil rig count was up 4

  • The pace of horizontal rig additions rose to -0.75 / week on a 4 wma basis.  

    • This number has been negative for 18 of the last 19 weeks

  • Our model suggests continued falls in the 1 / week range

  • Frac spreads were +7 to 290, but at about the same level as last May

  • Highlights from the April DPR report

    • DUCs: Earlier issues of the DPR showed small gains in the DUC inventory.  The current report shows declines instead, with continuous erosion in DUC counts since June 2020, albeit at the slow pace of 6 / week currently

      • At current estimated rig and spread productivity levels, we would expect the DUC inventory to continue to decline modestly

    • Crude and condensate production from key shale plays rose to 9.03 mbpd in March, up 80 kbpd from February, with shale oil output looking to set new all-time highs next month

      • Total shale oil production growth has averaged 42 kbpd / month over the last four months

    • Permian production was up 31 kbpd in March.  

      • Permian production growth has averaged 22 kbpd / month over the last four months

  • Overall, not too much change in the data, but for all that, production growth from key shale plays remains respectable according to the latest DPR.

Rigs and Spreads Apr. 21,pdf

More on March Border Apprehensions

After my prior post on March apprehensions, my friends at the Center for Immigration Studies reminded me that I was, in fact, overstating the improvement in southwest border apprehensions. 

In January, Customs and Border Protection implemented CBP One, which allows up to 30,000 Venezuelans, Haitians, Nicaraguans and Cubans to be admitted each month.  For an apples-to-apples comparison, CBP One entrants should be added to border apprehension totals, which would make the apparent improvement somewhat less impressive.

Mark Krikorian, Executive Director of the Center for Immigration Studies, details the problems with CBP One in a New York Post op-ed:

[CBP One] did, in fact, cause a drop in illegal crossings for a couple months, as prospective illegal immigrants adopted a wait-and-see approach. [This] made sense initially, because 99% of would-be illegal immigrants who got an appointment through CBP One ended up being let in and let go.  The problem is that CBP One doesn’t work especially well, and the number of slots it gives out each day is limited in any case — it’s almost a lottery as to whether you’ll get the OK.  This has led increasing numbers of people, lured to the US border by Biden’s rhetoric and policies, to skip the CBP One process and just jump the border as before.

Krikorian’s critique again highlights the inherent limitations of using a quantity-based approach.  If the price of the visa is set to near zero, then visa demand will vastly outstrip supply.  Consider: The effective minimum wage in the US right now is about $15 / hour or $30,000 / year.  Globally, 8.1 billion people live in countries with a per capita GDP below $30,000.   US minimum wage can seem quite low, but for many billions of people, it would be a big step up.  Therefore, any quantity-based approach like CBP One or the H2 visa programs will stock out immediately, leaving vast, residual demand.  The overwhelming majority of would-be applicants who fail to make it into the program are incentivized to attempt illegal entry.

To close the border, we need a price-based approach, which involves the on-demand availability of visas at a market price.  This circumvents the CBP One problem by allowing prompt access to visas by any qualified applicant at a price set by the applicants themselves for a given level of supply.  The visa price should be equal to the expected present value of illegal entry.  In other words, the migrant will decide whether to enter illegally or pay the visa price.  If illegal entry is better, then the visa price will fall to the market-clearing level and the border should close again.  Of course, the visa volumes need to be somewhere in the vicinity of underlying US business demand.  To provide some indicative numbers: my current estimate of the value of a migrant work visa is about $12,000 / year, and the necessary number of visas, given a hot US labor market, may be on the order of one million.  

Of course, this pushes the enforcement issue into the US interior.  The visa value, $12,000 / year, is about three times the annual income of an unskilled Guatemalan. Keeping migrants legal once they enter is the hard part, of which I have written at other times.

In any event, if we accept Krikorian's line of reasoning, that the CBP One program is failing and that migrants will resume illegal entry to earlier levels, then, of course, our annual apprehensions forecast will have to be revised upward.  Let's see what the data brings.

March Southwest Border Apprehensions: Still high; and a budding Chinese refugee crisis?

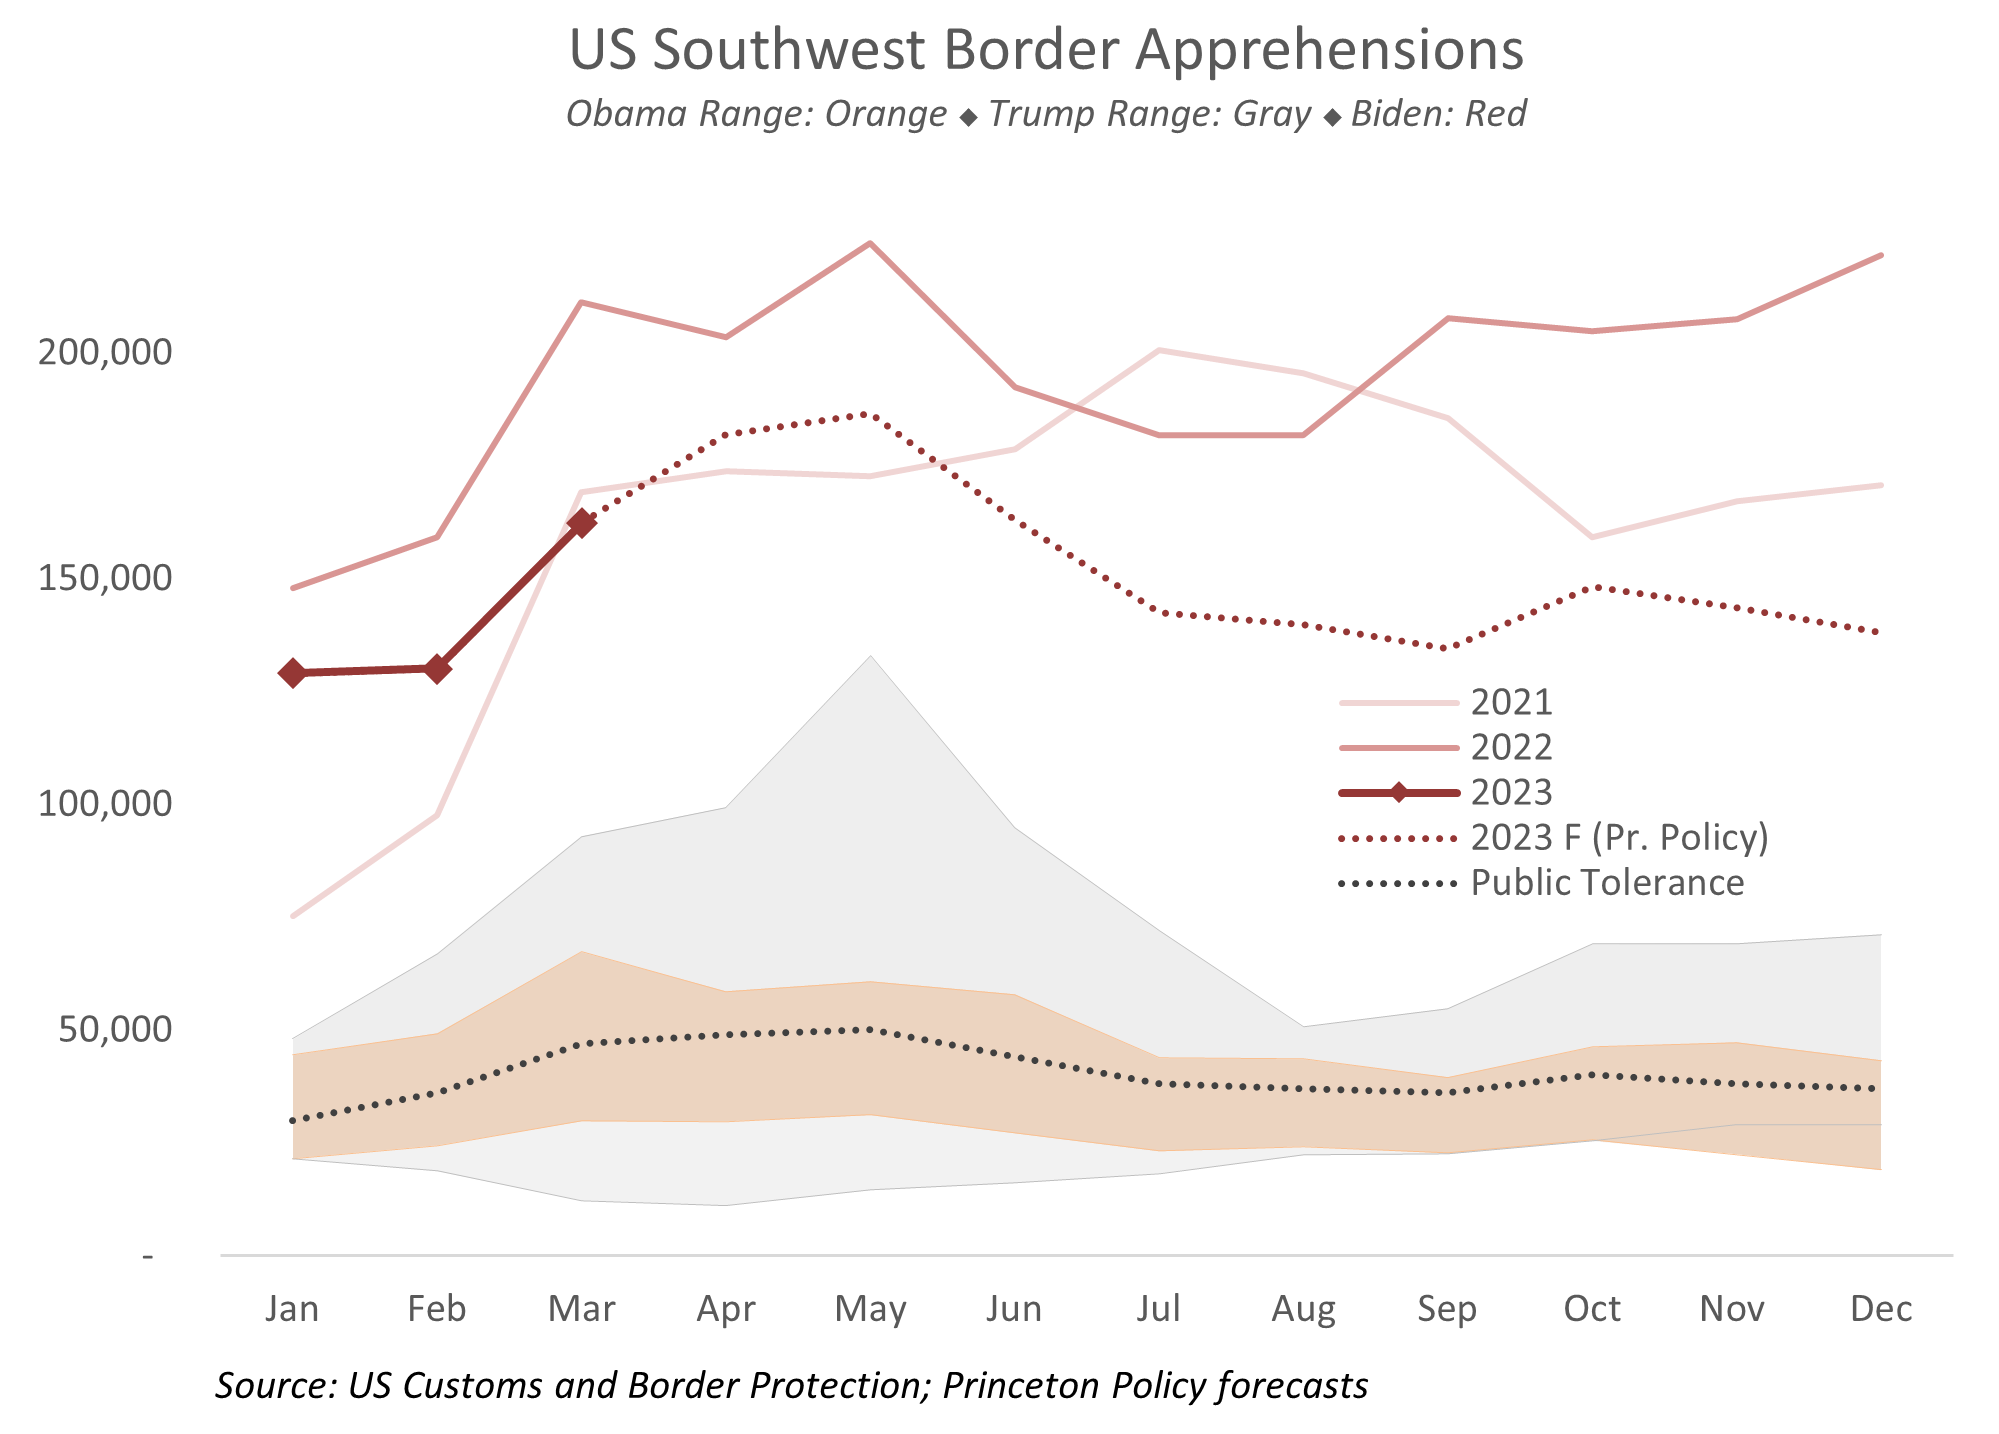
US Customs and Border Protection reported 162,317 apprehensions at the southwest border for the month of March.  This reflects normal seasonal gains given the new set of policies instituted by the Biden administration in January.  March apprehensions were the 5th highest for the month in the last quarter century, with the Biden administration holding three of the top five spots.  March apprehensions were still running more than three times the average for the month during the Obama and Trump administrations.  In other words, the situation has improved but remains dreadful.

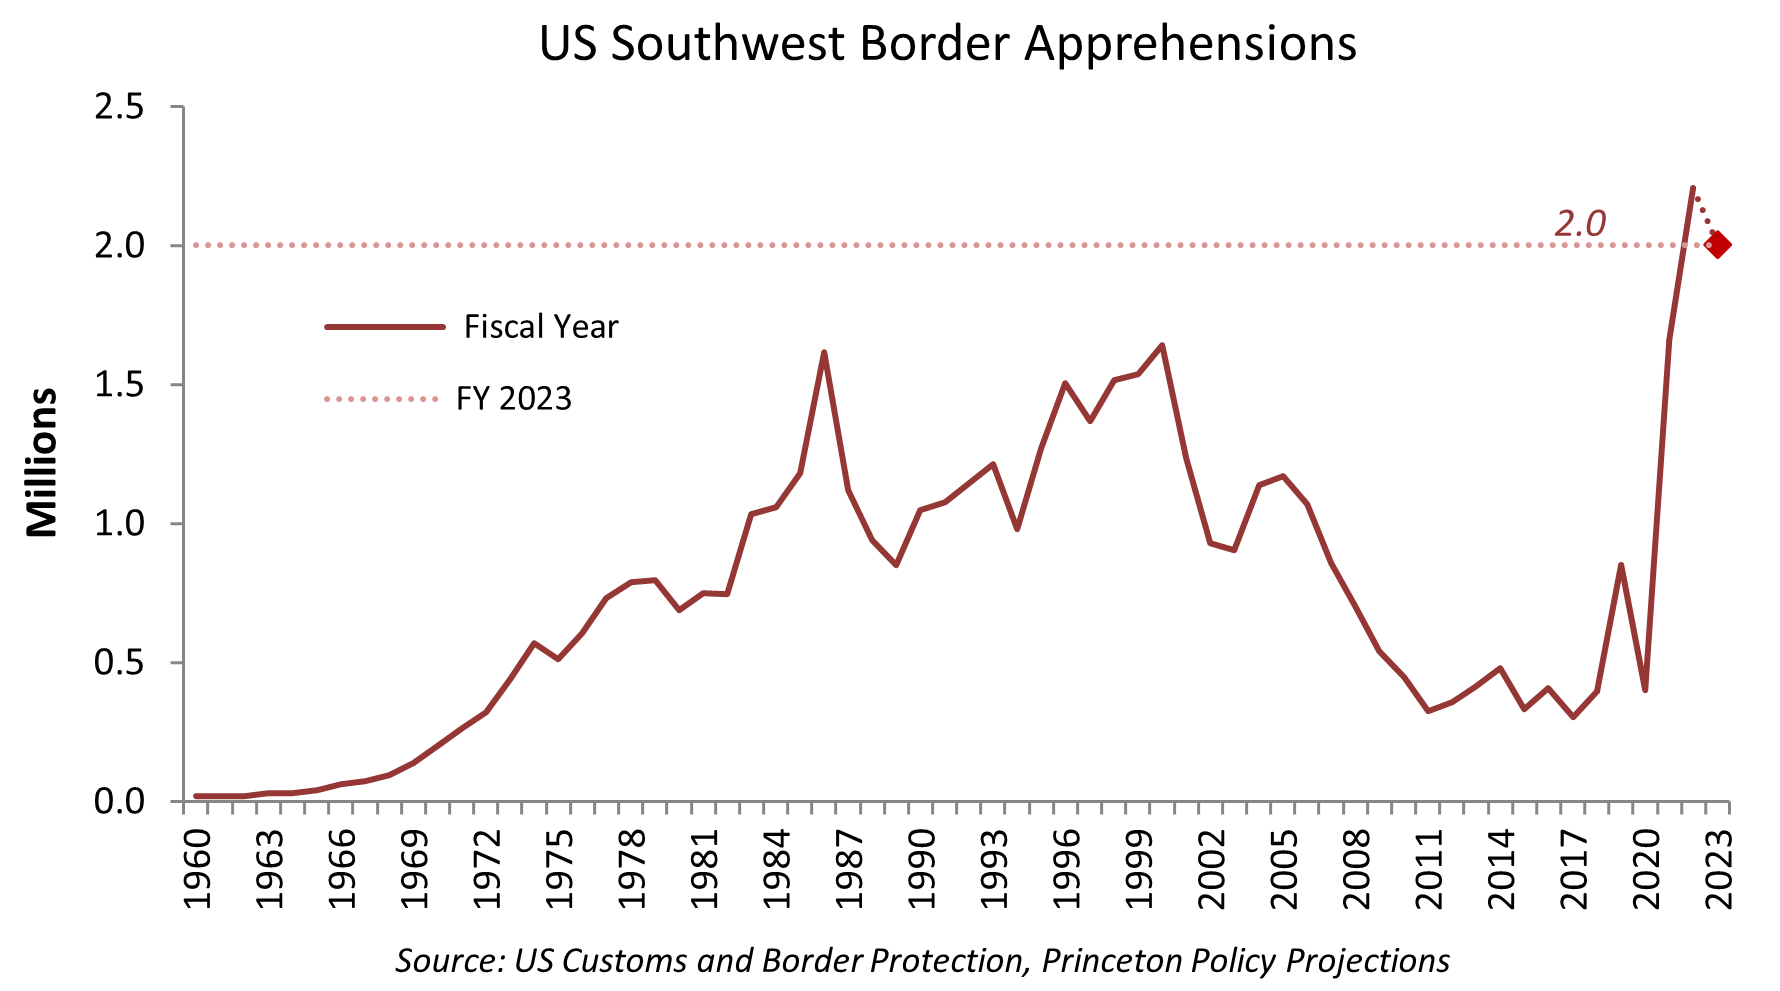
With the change of administration policy, our forecast for the year also changes.  Our prior forecast anticipated 2.7 million southwest border apprehensions for fiscal year 2023.  This is reduced to 2.0 million, which is much better.  On the other hand, our forecast for FY 2023 apprehensions still constitutes the second worst year on record, better than only last year.  So again, a big improvement, but still dreadful.  

The composition of apprehensions is quite interesting.  A substantial share of the growth in apprehensions arose from non-traditional sources, that is, outside Mexico and Central America (MCA).  Apprehensions of 'Other' (non-MCA) nationals soared from 4,000 per month before the Biden administration to a staggering 156,000 this past December.  Apprehensions of 'Other' nationals remain elevated at just under 60,000 for March.  Again, we see enormous progress, a decline of 100,000 / month, but on the other hand, 'Other' apprehensions continue to run at 15 times the normal level. 

Apprehensions of nationals from Mexico and Central America have declined by 20% compared to last March, but remain at roughly three times normal levels.

While apprehensions are showing improvement, inadmissibles continue to run hot.  Inadmissibles, those presenting themselves at official crossing points without appropriate documentation, were reported at 29,582 for the month of March.  This is both nearly three times the level of last year and a record since 2012 by a similar margin.  The data continues to speak to extraordinarily permissive conditions at official crossing points.

Finally, the Wall Street Journal reports a spike in the apprehensions of Chinese nationals at the southwest border.  While the absolute numbers remain small, the pace of growth is stunning, speaking to a rapidly deteriorating political environment in China.

Russian Oil Production: A Full Recovery in Sight

The Kyiv Post ran my piece from last week as an op-ed: The US, Ukraine and Trust .  Thank you, Bohdan.  Perhaps it will help gain a bit of traction with Ukrainian officialdom.  

Let me start by returning to my previous post on the Urals oil price, which has broken through the $60 cap.  Several readers pointed me to an analysis in Axios, The price cap on Russian oil seems to be working.  The Axios article covers the period through March.  The Urals price breakout occurred only in April, briefly a couple of weeks ago and more visibly this past week.  This period is not covered in the Axios piece.  Having said that, there are any number of problems with Price Cap even as described by Axios, chief among them that the Ukrainians have left about $50 bn on the table in the last year, enough to offset US Ukraine-related expenses by perhaps two-thirds or sufficient to buy 100 F-16s every two weeks.  This is a big deal and it will become a very, very big deal.  That's one takeaway from the Urals price breakout.

Russian Oil Production

Russian oil production continues to run ahead of the forecasts of the EIA, the US Energy Information Administration, the statistics arm of the US Department of Energy.  The EIA estimates Russian oil production at 10.83 mbpd for the month of March.  This is 0.3 mbpd below the prior month and 0.9 mbpd (4.4%) below Russia's pre-war output.  Russian oil production is declining, but not much, and in March was running a whopping 1.3 mbpd above the EIA's January forecast.

Further, on Friday, CNN reported that Russian oil exports have regained pre-war levels.  Yahoo Finance chimes in, noting that China and India are buying so much Russian oil that Moscow's now selling more crude than it was before invading Ukraine.

Given the Urals price breakout and the resumption of normal oil exports from Russia, the EIA's expectations for further reductions in Russian oil production are likely to be thwarted.  Indeed, I would not be surprised if Russia's oil production started to move closer to the Black Market Forecast which I made last July and can be seen on the graph below.

The EIA's substantial forecasting miss arises from the same source as the failure of the Price Cap: a lack of black market economic models.  (Indeed, this is the same issue DHS and the Bipartisan Policy Center face with illegal immigration, which is functionally the same problem.)  This is our unique field of expertise.