EIA PSR Week of Jan. 3: Modestly constructive

The EIA weekly report was modestly constructive.

  • Despite media reports of a ‘surge’ in product inventories, these are entirely normal when considering seasonality and demand factors.  Crude inventories are similarly normal.

  • Gasoline and diesel supplied (consumption) look quite healthy, both up and reflecting greater affordability at the pump.  The US consumer is feeling in a better mood.

  • Incentive-to-store analysis suggests that balances may remain relatively soft in the first half of the year, with gradual tightening through 2024.  This suggests comparatively subdued oil prices through Q1, but with a gradual rise towards the back end of the year.  Bear in mind this is current market sentiment, not necessarily a forecast.

  • US oil production declined 0.1 mbpd to 13.2 mbpd but is essentially flat over the last three months.  This is consistent with the EIA’s monthly STEO, which sees US production on a brief plateau and then declining modestly to a lower level through Q3.

    • Notwithstanding, the Brent Spread (Brent – WTI) remains reasonably wide, $5.50 / barrel at writing.  This is consistent, as before, with US production growth of around 800 kbpd / year.  Lively US demand and flat US production growth should be driving higher oil prices, but it’s not.  Maybe it’s China, or perhaps production growth is not fully captured in the data.

  • Overall, the report speaks to a healthy economy and balanced inventories, with a suggestion that production growth is better than the numbers say.

The Price Cap at Year End

Paul Bedard at the Washington Examiner kindly ran a piece based on my last post, here.  Paul has covered my work on illegal immigration for the last several years, now preempted by my more immediate concerns with the Ukraine conflict.  Also, find my editorials in Kyiv Post here.

Oil Prices

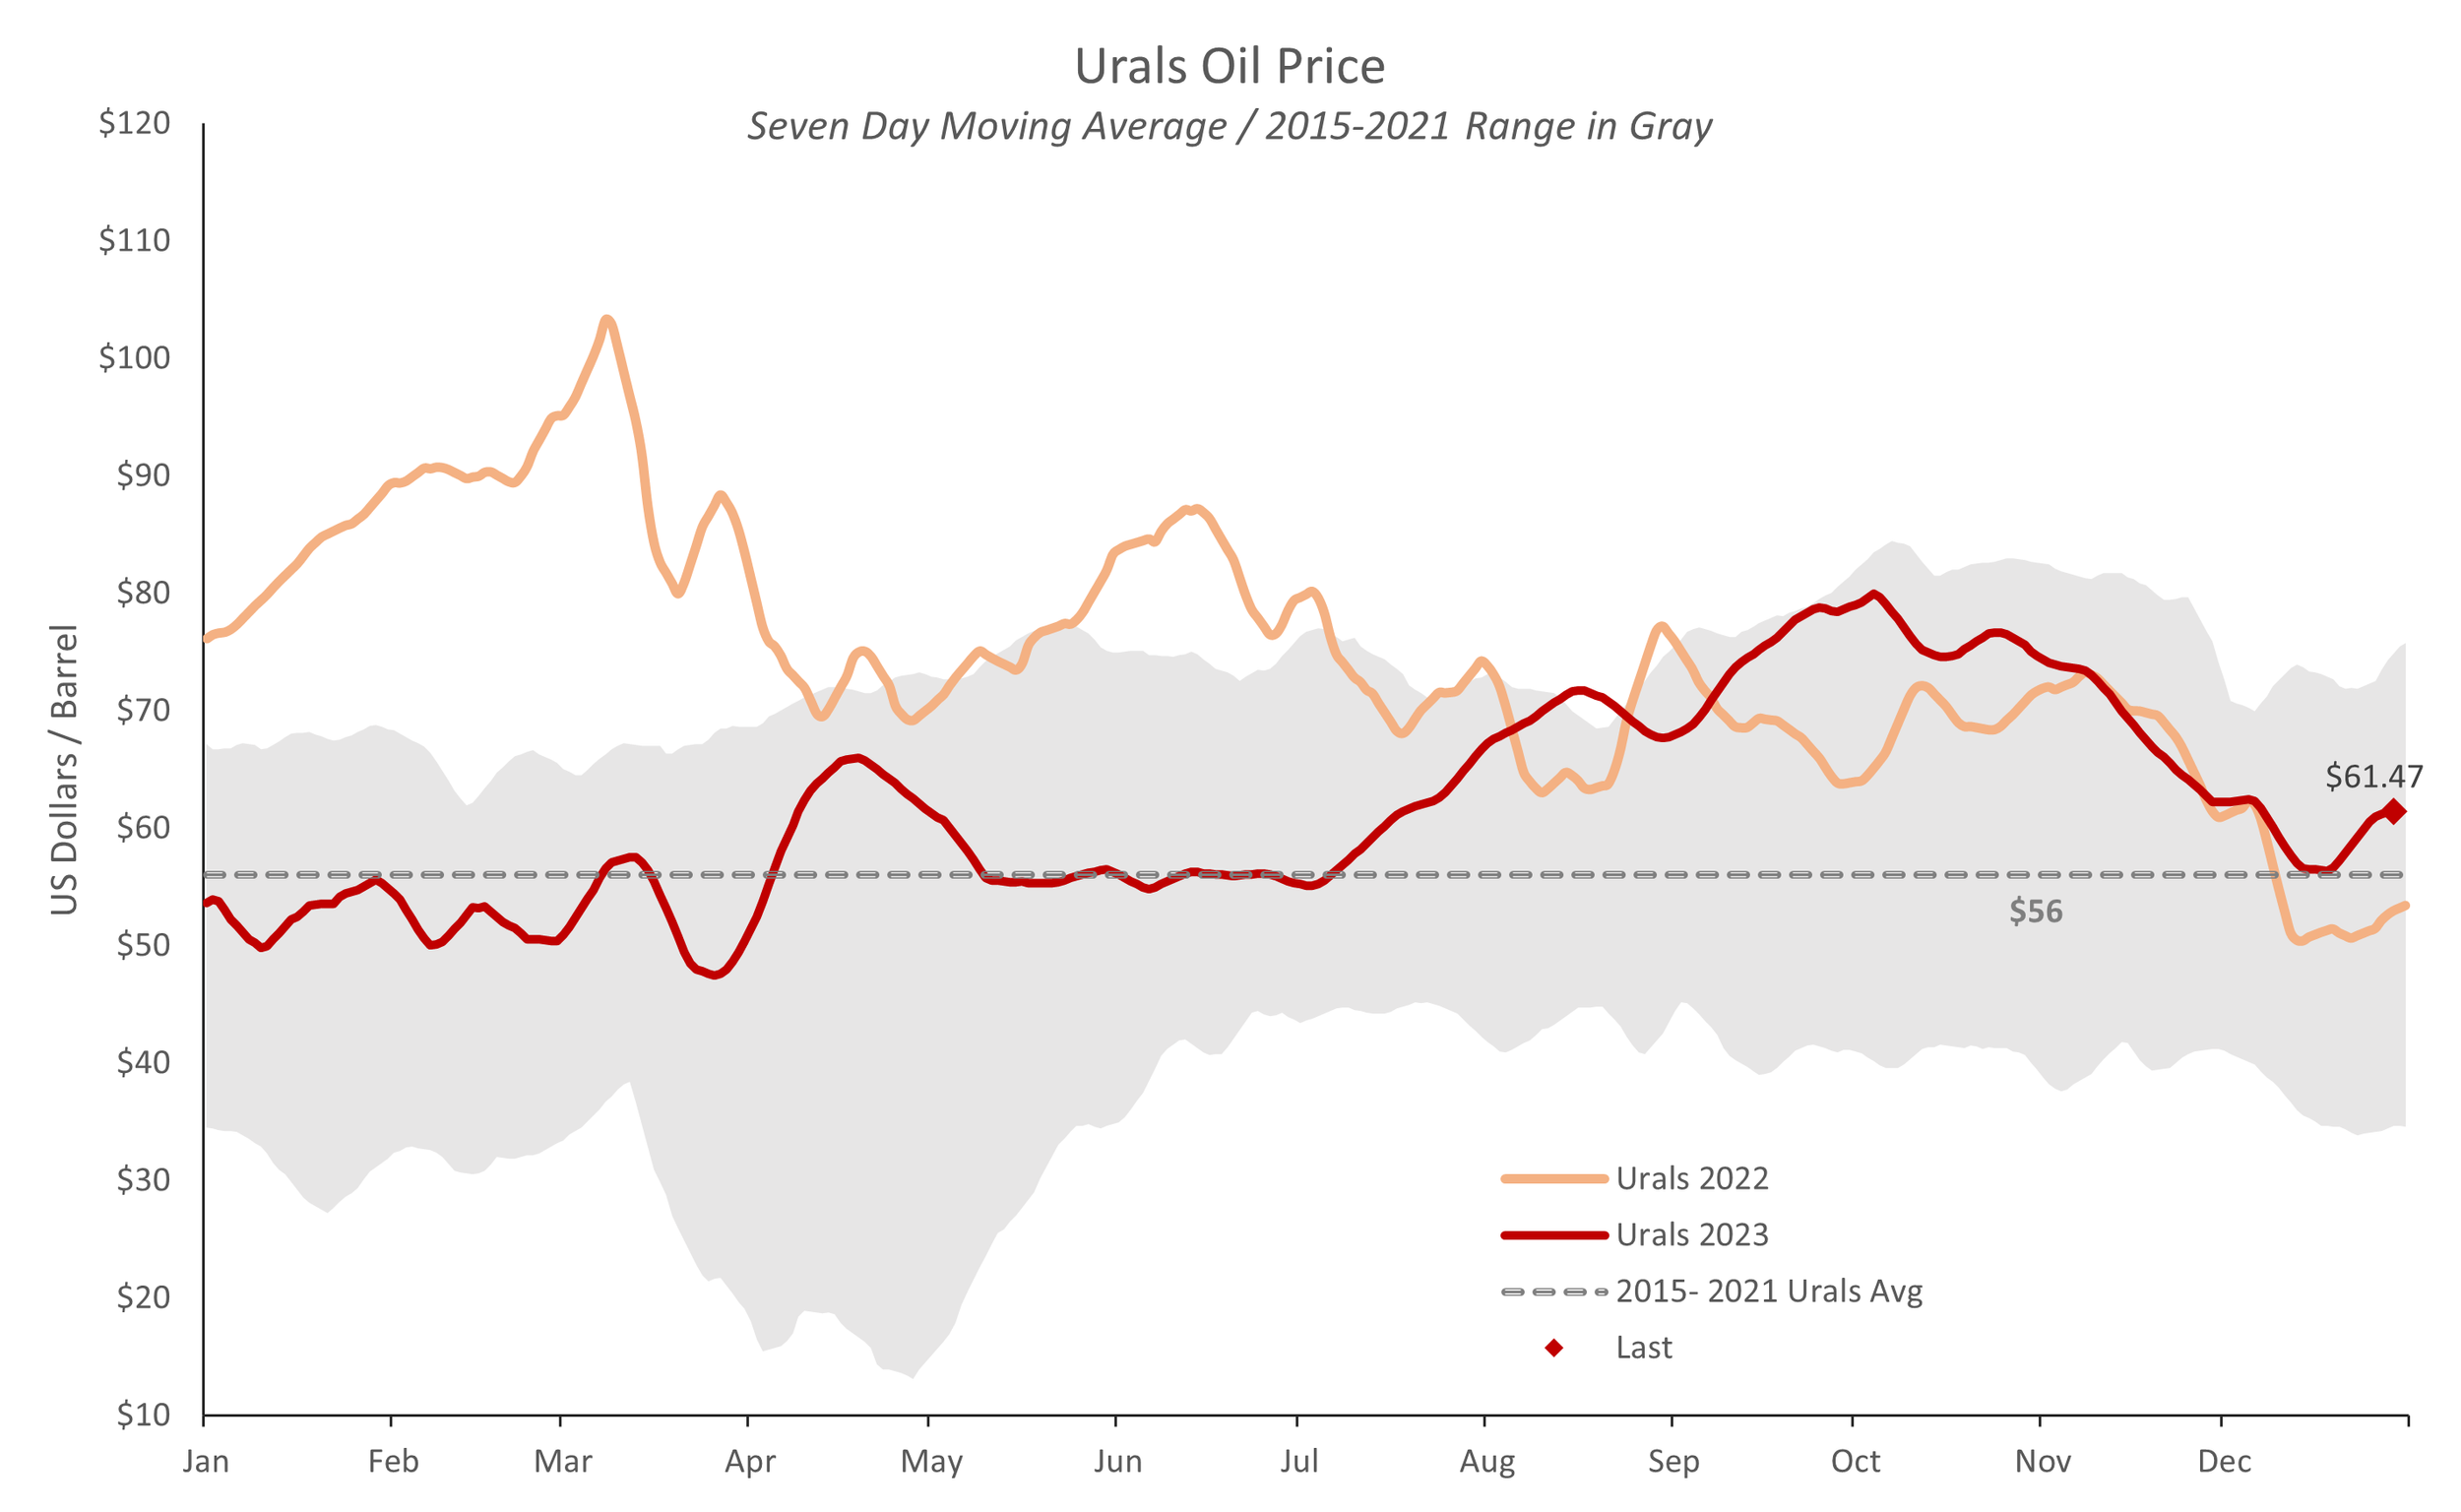
Brent closed the year at $77 / barrel, and Urals posted $61.47.  Urals is marginally above the Cap limit of $60, but still well off the $71 / barrel the Russian government is budgeting to fund increased war spending in Ukraine.  For now, this is positive for Ukraine.

The Urals discount -- the difference between Russia's western crude oil export price and the European benchmark Brent -- closed a bit to $17.50 last Friday.  This is $4 / barrel larger than our Brent price-adjusted forecast of $13.50.   (The Urals discount varies with, among others, the price of Brent.  The discount narrows by about $0.25 / barrel for every $1 gain in Brent.  Thus, if Brent rose from its current $77 / barrel to $87, we would expect the discount to narrow by $2.50 / barrel for this reason alone.  I'd note this is a low-confidence relationship with an R2 of only 0.11 on a 0.0-1.0 scale.  Take it as a rule of thumb, not as a rule.)

Once again, US enforcement seems to be producing some limited effect.  The discount is back in the range seen in June and July 2023, but much improved from the tight spread in October and November.  Thus, enhanced US Price Cap enforcement appears to have widened the discount, but only back to the levels which prevailed before October and November.  Still, it's better than nothing and positive for Ukraine overall.

Urals ended the year about $8 / barrel higher than a year ago.

Ruble Exchange Rate

Finally, the ruble ended the year at 90.4 ruble / US dollar, largely unchanged in the last two months.

The war is settling into a kind of deadly monotony and routine, and that's visible in the statistics as well.

The war could end in '24

With the close of the year, it is once again time to reconsider the prospects for the end of the war.  The major change, compared to our earlier analysis, is the elevated pace of Russian casualties.  During November and December, the Russians lost just shy of 1,000 men per day, according to the official Ukrainian count.  This is a spectacular pace of loss and, if continued, could shorten the war by as much as a year.

The length of wars is determined by a number of factors.  These include the belligerents' economic and military capabilities, as well as their ability to maintain political cohesion.  Military deaths are a key factor in the public's willingness to sustain a conflict. Prior wars can therefore provide some insight into the limits of, in this case, Russian perseverance. The current Russo-Ukrainian war already qualifies as the fourth deadliest external conflict in Russian history.   The third is the Crimean War (1853-1856), which lasted 900 days and cost the Russians 450,000 dead in a losing effort.  At the recent pace of Russian losses, the current conflict will move into third place before Easter.  It is worth noting, however, that the population of the 1850s Russian Empire was approximately half of its current level.  Therefore, adjusted for population, Russian eliminations would need to rise to 900,000 for the current conflict to qualify as third worst of all time and, by historical precedent, induce Russian capitulation.

At the lower limit, Moscow might plausibly face meaningful public resistance around 650,000 Russian military deaths, about twice the current number and half again as much as from the Crimean War of 1853.  This view is based on three factors.  First, deaths are simply more visible today, even with the various censorship programs employed by the Russian government.  Second, Russia is for all that a marginally more civilized country than it was in the 1800s, and the public's tolerance may be accordingly less.  Third, and most importantly, this war is entirely discretionary for Russia.  Unlike World War I, which saw massive losses of Russian territory, including Finland, Poland, the Baltics and Bessarabia (largely today's Moldova), Russia is facing no territorial losses compared to the pre-war era.  Further, no fighting is occurring on Russian soil and no one has attacked Russia.  The war poses no existential threat to Russia as did, for example, the German invasion during World War II.  St. Petersburg is not under siege, no one has sacked Moscow, and there is no house-to-house, to-the-death fighting in Stalingrad (Volgograd today).  Thus, the Kremlin must justify 650,000 deaths for what was supposed to be a mere three-day, special military operation entirely of Putin's choosing.  Russia's Achilles heel is exactly the low stakes of the conflict.  Putin could order the troops home tomorrow, and Russia would be no worse off than in 2014, a time when Russia was actually seeing something of a renaissance.  

At the current pace, Russian losses will reach 650,000 dead by late 2024.  If this proves to represent a threshold of public tolerance, the war could end at that time.  The next stop is one million Russian dead, which could be expected by autumn 2025 at the current rate of eliminations.  If the war extends so far, it will have lasted as long as World War I for Russia, and the media will routinely compare the conflict to the Great War, which saw 1.8 million Russian military killed (1.5 million adjusted for Russia's current population).  Although Putin claims Russia will fight for five years, the Russian public found the losses of World War I intolerable and overthrew their government.  If Russia continues to lose 1,000 soldiers every day, Russia will likely concede the war before the end of 2025. 

For Americans, there are some important takeaways. 

First, this is a major war.  It will rank third in all of Russia's bloody history by the time the tulips bloom this spring.  This is not some minor conflict in a faraway country, but a major European conflict requiring substantial determination and commitment. 

Second, this is not a forever war.  It will be resolved in some fashion within two years if hostilities remain at their current pitch. 

Finally, independence is worth a very large number of Ukrainian lives.  The outcome of this war will likely determine the fate of Ukraine — and Europe — for the next century, just as the defeat of the Ukrainian struggle for independence in 1917 determined Ukraine's narrative until the fall of the Soviet Union in 1991.  The Bolshevik defeat of Ukraine's republic set the stage for the Holodomor, which claimed up to 5 million Ukrainian lives, and presaged the Soviet domination of Eastern Europe for a half century. 

The Ukrainians need to decide what independence is worth.  If I compare it to Hungary, from which my family fled in the closing days of World War II, we would have gladly fought and thought losses of two percent of the population worth it if Hungary could have retained its independence in 1945 or regained it in 1956.  That equates to nearly one million Ukrainians, and at the current rate of exchange, 3-5 million Russians.  If it is worth the price to Ukrainians, the Russians will lose, as long as Ukraine's allies stand beside it.

Urals below Cap; Some success with enforcement; Let's stop pussyfooting around

Russian Oil Prices

Brent continued to drift downwards this past week, just under $76 / barrel at writing.  Urals accordingly fell, just under $57 on Monday, its lowest since July and now below the $60 Cap threshold.  All this is good for Ukraine.  

Some analysts believe oil prices have found a floor.  Copper prices, another proxy for the state of the global economy, suggest Brent should be priced around $84.  Nevertheless, questions linger over the health of the Chinese economy and whether US oil production growth is understated.  Analysts seem a bit perplexed overall, and that includes this one.  More on this when the EIA publishes its monthly statistics later this week.

The Urals Discount, the difference between Russia's western crude export price and Brent, has widened to $17 for the past week as a whole.  This contrasts with our forecast of $12 / barrel, implying that recent sanctions against UAE shippers have had an effect worth about $5 / barrel.  The Biden administration can bank this as a modest, short-term win, but a win nevertheless.  

For doubters, I would note that the ESPO discount, the difference between Russia's eastern oil export price and Brent, is closing faster than our forecast, posting at $3 / barrel versus our forecast of $3.40 / barrel for the week.  Russia's eastern sales are not substantively subject to the Price Cap, so the divergence between a shrinking ESPO discount and a growing Urals discount can be attributed to enhanced enforcement in the Urals zone.  Again, a small but useful win for the Biden administration.

The ruble has crept up to 91 / USD and showing a slight weakening trend attributable to softer Brent, and hence Urals, oil prices in the last few weeks.  Again, this is good for Ukraine.

As noted above, the Urals oil price is about the same as last year and essentially the same as Russia's average export oil prices from 2015 to 2021.  Overall, this is a positive for Ukraine, as it makes higher military spending more problematic for the Kremlin.  

Reluctance to Fund Ukraine

Ukraine's allies are beginning to show an indifference to the fate of that country.  This needs to be remedied, but should not be surprising.

It's a slough

The US public struggles to grasp the scale of the conflict.  Americans have come to expect the US to crush its adversaries in a matter of weeks without material sacrifice or anguish for the country as a whole.  Such was the case with the first and second Gulf wars, the invasion of Afghanistan, and various smaller conflicts spanning the last forty years.  The Israelis are mopping up Hamas in just such a style.

Ukraine is different.  By population, Russia remains by far the largest country in Europe and, despite its incompetence on the field, can still muster a large army with a vast, if unimpressive, array of weaponry.  The battlefield in Ukraine has come to resemble the fronts of World War I, where vast sacrifices of men and materiel yielded minimal changes on the ground.  The conflict has devolved into a monotony of death, where 1,000 casualties per day are no longer newsworthy and footage of tanks and artillery exploding have become just more of the same.  Under the circumstances, the average American wants it all to end.  That's particularly true of a war in a far away country with its own checkered past.

It's the economy, stupid! (Sort of.)

The reluctance of the US and European public is not just a matter of emotions.  A recent Bankrate survey shows that, by a margin of 2-to-1, employed Americans feel that their wages are not keeping up with inflation.  Thus, despite robust recent GDP growth and near full employment in the US, Americans are largely unhappy with the economy.  Although funding the Ukraine war is not material in the overall US economic picture, it nevertheless represents to many an extravagant outlay on a discretionary war at a time when they feel their own budgets are pinched.

The public mood is affecting the political landscape.  An NBC News poll from September found the GOP advantage on the economy to be the highest recorded in more than three decades of NBC News polling.  Ukraine funding is part of that, and it is affecting the attitude of political leadership.

Isolationism

Finally, the US has traditionally had a strong isolationist streak.  For example, as late as September 1940 -- a year after the fall of Poland, after the capitulation of France and well into the Battle of Britain -- only a bare 52% of Americans believed the United States ought to risk war with Germany to help the British.  Britain and France are far closer to Americans' hearts than Ukraine will ever be, and yet Americans were all but unwilling to lift a finger to help our core European allies before Pearl Harbor ended the debate.

All these factors matter in the US.  They need not paralyze policy, but they need to be understood, respected and addressed.

Three Takeaways

Biden needs to lead

The war in Ukraine is attributable to a failure of deterrence by the Biden administration.  The disastrous pullout from Afghanistan marked President Biden as a weak leader and encouraged President Putin to try his hand at Ukraine.  When Biden declined to deter Russia with promises of direct military assistance to Ukraine, Putin again felt he had a green light to invade.  Only when public opinion nevertheless demanded that the US government support Ukraine did the Biden administration take a stand, but even then slow-played the provision of arms and other support, allowing the Russians to entrench and deliver the stalemate which now prevails.  In addition, the on-going vacillation in US policy fuels the current Russian onslaught in Ukraine.  

If the Republicans are reluctant to fund the war, well, President Biden has given them leeway to do so.  Instead, the President should stand up and declare that the US intends to see the war through to victory.  If the Republicans want to champion a loss in Ukraine, let them own it.  If Republicans want to run on 'I'm the guy who lost to the Russians', let them run on it.  The Republicans are rapidly getting used to losing elections they should win.  But if the President thinks vacillation will win him political support, it won't. It will only reinforce a view of him as a weak leader.  Biden needs to stand up and clearly declare that the US is playing to win.

The Republicans need to get serious

On the face of it. Ukraine's position vis-à-vis Russia looks dire.  The IMF estimates Ukraine's GDP, as measured in current US dollars, to be only 9% that of Russia, and the situation is not expected to change materially in the future.   As a result, Russia can afford to spend more on the war.  A lot more.  Russia's planned 2024 military expenditure more than doubles from pre-war levels to $109 bn for 2024.  This is more than Ukraine's entire GDP.  Barring a reform of the Price Cap, Russia can sustain this level of spending indefinitely.  Without external support, Ukraine's long-term position looks dire indeed.

​However, the matter looks quite different in the broader context.  While Russia's economy is large compared to Ukraine's​, it is chump change compared to the US economy, which is 14 times larger as measured by current US dollar GDP.  The comparison is even more ridiculous if Ukraine's broader set of allies is included, which together with the US, have a GDP 27 times that of Russia.  The notion that the US and Europe are somehow unable to keep pace with Russian military spending is absurd on the face of it.  This is the equivalent of a 270 lb. man being afraid of a 10 lb. child.  Indeed, the IMF projects the US economy to add the equivalent of two Russias to 2028.  

The question is whether Republican leadership intends to lose to a Russia which qualifies not as the high school varsity team, not as the junior varsity, but as the eighth grade pick-up team.  Does House Speaker Johnson really intend to be remembered as the guy who lost to the eighth graders?  One would hope not.  It's time to stop fooling around and get back in the game.

None of this should be construed as antipathy to many Republican objectives, including accountability for Ukraine funding and reinstating border control.  No one has garnered more coverage in the right media than I have regarding the border, and no one has been more critical of administration border policy than I have.  Notwithstanding, it's time to stop fooling around with Ukraine's funding.

Beating the Russians

Beating the Russians requires men, money and materiel.  Of these, money is arguably the most important, for it buys men and materiel.  A key means to beat the Russians, therefore, is to have more money, and that involves contributing more of one's own and taking the Russians' money away.  

Russia's defense spending, as noted above, more than doubles its pre-war level to $109 bn in 2024, versus $48.2 bn in 2021.  The pre-war budget was funded by Russian oil export prices averaging $56 / barrel from 2015 to 2021.  The Russians are budgeting Urals at $71 / barrel for 2024, which, augmented by a higher ESPO price, provides an incremental $48 bn for the Russian government in 2024 and thereby funds the lion's share of Moscow's surge in military spending. 

Of this, more than $30 bn can be seized from the Russians, even at today's low Brent and Urals price.  Once Russian oil revenues are redirected to Ukraine, the entire calculus changes for Moscow.  Its available resources will be trimmed, requiring deeper spending cuts to social programs or higher inflation, or both.  Add to that 1,000 eliminated Russians every day, and the war will prove untenable over time, even as the funding support from the US and other allies remains tolerable from the perspective of domestic politics. 

As a conceptual matter, beating Russia is not particularly hard.  We have a bigger stack of chips at the poker table.  A much, much bigger stack. With that, our strategy comes down to a predictable call-and-raise.  Whatever the Russians put in, we put in more. And if we want to save money, we reach across the table and take the Russians chips away from them.  

Right now, we need policy that is steady and confident, with the awareness that we are the big boy at the table.  It will still be a long war, but we can easily regain the upper hand.

Rigs and Spreads Dec. 1: Nice adds

Horizontal rig counts rose by 6 this past week, closing the best four week stretch in a year.  WTI at $90 appears sufficient to bring incremental rigs into operation.  Alas, oil prices have been dropping for the last several weeks, and while we may still see rig gains next week, counts should start to fall as we head towards year-end.  Indeed, they should fall at a fairly rapid pace into January, assuming our breakeven analysis holds up.  

  • Rig counts

    • Total oil rig counts: +5 to 505

    • Horizontal oil rig counts: +6 to 457

    • The Permian horizontal oil rig count: +3

  • The US horizontal oil rig count is rising at a pace of +3.50 / week, the best in a year

  • Frac spreads fell, -5 to 276  

    • DUC inventory, as measured in days of turnover, fell to a new low of 12.4 weeks

    • More rebalancing of the rig-to-spread ratio is required; this week is suggestive of trends to come, with rigs rising and spreads falling

  • The Brent Spread (Brent – WTI) remains near $5 / barrel, suggesting US production growth remains solid

EIA PSR Week of Nov. 24: The data's buggy

  • Excess crude and key product inventories are normal when allowing for seasonality and demand.  

  • Gasoline and diesel supplied (consumption) look suspiciously low and product exports appear unusually high, but otherwise, the picture is as it has been on the consumption side, with refined product consumption running about 5% below normal.

  • Incentive-to-store analysis shows that market sentiment has been absolutely crazy over the last month and a half.  On Sept. 27, the market perceived a huge crude supply deficit.  This has reversed into the current modest surplus, per our analysis of the futures curve.  This really should not happen, but clearly, it has.

  • US oil production remains flat at 13.2 mbpd, as it has been for the last eight weeks.  I cannot find a similar eight week stretch in the data, which suggests that the EIA is winging it, as the EIA’s new software upgrades remain unreliable in reporting production.

  • The Brent Spread (Brent – WTI) has widened to $5 / barrel, which is normally consistent with US production growth of around 800 kbpd / year.  US production growth is likely under-estimated, possibly materially so.

  • Overall, the EIA’s software upgrade remains buggy.  The missing barrel count (red circle, the difference between the light and dark blue lines, graph above), instead of declining as the EIA had no doubt hoped (green circle), has exploded, and seemingly in a cumulative fashion.  This is not unusual for software modifications, particularly in such rich, data-intensive and near-real-time systems as the EIA uses.  It’s really the 8th wonder of the world, but the EIA will require a few weeks to iron out the kinks. Take the data with a grain of salt in the interim.

Urals weaker; Ruble stronger; UAE mischief; Danish grit

Russia Oil Prices

Brent has settled into the low $80s, closing on Wednesday at $82 / barrel.  Urals tracked Brent with a few days' lag, closing at $65 mid-week. Urals is $9 / barrel above the 2015-2021 average and $5 above the Price Cap.  This is good for Ukraine, as last week.  

Oil demand depends upon the state of the global economy.  The US economy is unwinding pandemic fiscal and monetary policy, and prices of a number of goods are falling, yet remain well above their pre-pandemic level.  The question is therefore whether the US sees a 'soft landing' with the economy returning to pre-covid levels, or whether it overshoots into a recession.  The price of oil will depend heavily on which version proves out.  Moreover, China's economic prospects remain uncertain, and we might expect a financial crash there as the country transitions from a high growth to a lower growth regime.  But when?

US shale production set the price of oil from mid-2014 until December 2021, and still remains a key constraint on oil price increases.  The EIA has called peak US oil production for this past August, but statistical analysis suggests production growth may be higher than thought.  The EIA has revised US production up by about 1 mbpd since the summer, and another material revision would come as no surprise.  If US production is growing faster than believed, then oil prices could be quite a bit softer, at least for a few more months.

Thus, we have a fair amount of uncertainty on both the oil demand and supply side, none of which should influence appropriate policy regarding the Price Cap -- although reforming the Cap would be easier in a lower oil price environment.

As we forecast last week, the Urals Discount, the difference between the Urals and Brent oil prices, widened again this week, on Wednesday reaching $14.69 / barrel for the week as a whole.  The ESPO discount also widened, but is now under $4 / barrel.  China has agreed to work with the US on certain matters, and opening the ESPO discount wider should be on the table, as a discount of a measly $4 is less than the difference between Brent and WTI.

Ruble

The ruble continues to appreciate against the dollar, closing at 88.4 ruble / USD on Wednesday, likely buoyed by high oil prices during the last month or two.  If Brent stays weak for any period of time, expect the ruble to slip back into the 90s.

The US Treasury sanctions UAE Mischief

The US Treasury sanctioned three UAE-based companies for shipping oil above the $60 / barrel cap.  The Treasury details the penalties:

[All] property and interests in property of the [sanctioned] persons above that are in the United States ... are blocked, [as are] any entities that are owned ... by one or more blocked persons. These prohibitions include the making of any contribution or provision of funds, goods, or services by, to, or for the benefit of any blocked person and the receipt of any contribution or provision of funds, goods, or services from any such person. 

The respective shipping companies are short-lived, special purpose vehicles chartering the tankers in question.  It is fair to assume that these shell companies have no assets in the US and that the owners, if they can be identified at all, are either strawmen or have no interests in the US.  The Treasury precludes these companies from using US suppliers.  This principally matters for insurance, and that is primarily British.  If British insurance is unavailable, these shipping companies can use Russian insurance.  Thus, Treasury sanctions look largely toothless and symbolic.  This is typical of prohibition enforcement.

The UAE is more broadly a hub for Price Cap evasion and serves as a case study of the black markets, corruption, and the antagonistic behavior which arises as a result of prohibitions.  More on this in a separate post.

Danes show some Grit

The Financial Times reports that "Denmark would target tankers transiting the Danish straits without western insurance, under laws permitting states to check vessels they fear pose environmental threats."  This must have come from the Danes themselves, and it is a welcome display of initiative and determination.  Of course, the proposal was torpedoed as soon as it was launched, as black market theory predicts.  Prohibitions attempt to prevent willing buyers from transacting with willing sellers, and the Danish initiative would prevent those willing buyers, indirectly the G7 countries, from acquiring needed oil.  Therefore, the proposed interdiction never saw the light of day, as we would expect.

Nevertheless, this is very much the right idea.  It cannot. however, be enforced in the form of a prohibition.  Black market theory makes that plain enough.  But there are better alternatives.

Rigs and Spreads Nov. 17: Rig and spread gains within overall steadiness

The breakeven to add US horizontal oil rigs now exceeds $90 / barrel WTI. That is, at $90 WTI, we can expect US operators to be cutting rigs. That is incredible by the standards of the last decade, when analysts like Goldman Sachs spoke of $30-40 breakevens.

  • Rig counts are essentially holding steady over the last five weeks

    • Total oil rig counts: +6 to 500

    • Horizontal oil rig counts: +6 to 452

    • The Permian horizontal oil rig count: +5, the biggest gain since February

    • The Canadian horizontal oil rig count eased back this week, -4 to 119, now 10 below this week last year

  • The US horizontal oil rig count is rising at a pace of +0.75 / week on a 4 wma basis.

    • This number is positive for the third time in the last 50 weeks

  • Frac spreads rose, +8 to 276  

    • DUC inventory, as measured in days of turnover, fell to a new low of 12.8 weeks

    • Since July 2020, 16% of completions have come from cannibalization of DUC inventory

  • The Brent Spread (Brent – WTI) remains open, suggesting US shale oil production is exceeding expectations.

    • This is also true if we consider US production including unaccounted-for barrels, which continues to suggest production growth in the 600-800 kbpd / year pace

Rigs and Spreads Nov 17.pdf

Ukraine Funding: The Price Cap and Illegal Immigration are the Same Problem

Russian Oil Prices

Brent continued to unravel last week, closing on Friday at $81.  Accordingly, Urals has also fallen just below $70 for the first time in two months.  A lower Urals price is good for Ukraine, although it remains well clear of the $60 Price Cap.

The Urals discount -- the difference between Brent and Russia's western crude oil export price -- narrowed to $10.00 / barrel last week, but this is likely an artefact of reporting disparities between Brent and Urals.  Expect the discount to widen to $13.50 as Brent stabilizes.

The EIA issued its November estimate of Russian oil production this past week.  The Russian oil supply has been revised up 0.1 mbpd across the board starting in September 2022.  Such revisions are not unusual for the EIA and are minimal considering uncertainties about Russian oil production during this wartime period.  At 10.6 mbpd, Russia's October oil production was 7% below its pre-war output and 11% below the EIA's pre-war forecast for the month of October.  As last month, the EIA expects no further reductions in Russian oil output, and indeed, sees Russian supply increasing by 0.15 mbpd (+1.4%) heading into 2024.

The Price Cap and Illegal Immigration

The new Speaker of the House, Mike Johnson (R, La), finds himself in a precarious situation.  On Saturday, he unveiled a proposal to avoid a partial government shutdown by extending government funding for various programs until Jan. 19 and Feb. 2, according to the Associated Press.  The bill excludes the funding for Israel and Ukraine which the Biden administration has requested.  Johnson defended the bill as placing the "conference in the best position to fight for fiscal responsibility, oversight over Ukraine aid, and meaningful policy changes at our Southern border.”

Thus, funding for Ukraine has become intertwined with illegal immigration.  Since evading the Price Cap and illegal immigration are the same problem in economic terms -- both are black markets -- they can be addressed with similar approaches.  

Black markets arise as a result of prohibitions.  A prohibition occurs when a government attempts to prevent willing buyers from transacting with willing sellers at market prices.  Illegal immigration exists because the demand for US work visas is vastly greater than the supply of those visas at the offered price of $190.  Therefore, unskilled labor from Latin America and elsewhere has an incentive to jump the US border, knowing that willing buyers -- US businesses -- are waiting to purchase the migrants' labor at 4-7x the wages of their home countries.  That's illegal immigration in a nutshell.

The Embargo and Price Cap on Russian oil are essentially similar.  The Russians want to sell, and global refiners want to buy, Russian crude at market prices.  The Embargo and Price Cap are intended to prevent such transactions.  Neither has succeeded.  The Embargo has led to a simple restructuring of oil trade flows, with India, China and Turkey replacing Europe as Russia's primary export market.  Similarly, the Price Cap has motivated Russia to circumvent such controls, for example, by the establishment of its own 'shadow fleet' of tankers and fraudulent declarations by market participants regarding agreed oil prices.  This was entirely predictable, as enforcement-based approaches fail almost without exception, regardless of the product, country or historical period.  

The US does, however, have three examples of success in ending black markets: the repeal of Prohibition for alcohol; the legalization of gambling; and the partial and halting legalization of marijuana. This is not the place to dwell on particulars, but the graph below illustrates the potential of the legalize-and-tax approach.  In Fiscal Year 2023, border apprehensions of illegal immigrants were running six times the level of the Obama administration, and Border Patrol seizures of hard drugs like cocaine, heroin and fentanyl were twice their Obama-era level.  By contrast, Border Patrol seizures of marijuana at the southwest border are running at 1.8% -- that's right, 1/55th -- of the level of the Obama administration.  Smuggling of cannabis over the Mexican border has all but ended, and in fact, today the US is a net smuggler of marijuana into Mexico by value.  That's the power of the legalize-and-tax approach, and we can use it to both close the border to illegal immigration and reform the Price Cap.

If the Speaker and the Republican conference are looking for alternatives, a legalize-and-tax approach can work for both border control and Ukraine funding.  

The Republicans can require the Biden administration to begin a formal assessment of a legalize-and-tax approach to border control.  This would avoid creating an obstacle to passage of a Continuing Resolution while initiating the first, crucial step towards ending illegal immigration using the proven, textbook approach.  President Biden can agree to such a proposal, for it would help his re-election prospects as well.  I would note that the legalize-and-tax approach to end illegal immigration has been endorsed by the Washington Examiner and received constructive support from the likes of Breitbart and the Epoch Times.  The hard right is willing to take a look, and that should provide some comfort to Republicans as they consider options.  

Meanwhile, Republican requirements for oversight of Ukraine spending are far too modest.  The principal goal should not be Ukrainian accountability (although this is desirable), but rather making the Russians pay for the war, and not only the war, but Ukraine's reconstruction and the full spectrum costs incurred by the US and Ukraine's allies for the conflict.  It's not about ensuring US taxpayer money is well spent; it's about making sure the taxpayers get their money back.  

General George Patton, America's most prominent general of World War II, once famously declared, "No bastard ever won a war by dying for his country. He won it by making the other poor dumb bastard die for his country."  A legalize-and-tax approach can make the other poor dumb bastard pay for the war.  That's something Democrats and Republicans can both support.

Rigs and Spreads Nov. 11: Breakevens above $90!

The breakeven to add US horizontal oil rigs now exceeds $90 / barrel WTI. At $90 WTI, we can expect US operators to be cutting rigs. That is incredible by the standards of the last decade. What nostalgia one can have for the go-go days of $30 breakevens!

  • Rig counts

    • Total oil rig counts: -2 to 494

    • Horizontal oil rig counts: +3 to 446

    • The Permian horizontal oil rig count: +2

    • The Canadian horizontal oil rig count saw progress this week, +3 to 123, but now 5 below this week last year

  • The US horizontal oil rig count is falling at a pace of -0.75 / week on a 4 wma basis.

    • This number has been negative for 47 of the last 49 weeks

  • Frac spreads fell, -2 to 268

    • DUC inventory, as measured in days of turnover, rose modestly to 13.9 weeks

  • The Brent Spread (Brent – WTI) remains open, suggesting US shale oil production is exceeding expectations.

Ruble +8% on US dollar, Ukraine support eroding

Let's start with Price Cap metrics.  

Brent and the Urals price had a ho-hum week, without material movement in either price.  Brent closed the week at $85 / barrel, and Urals at $74.  A wilting Brent is signaling weakness in the global economic outlook, but this happens from time to time without a broader downturn.  But not always.

The Urals discount -- the difference between Russia's western crude oil export price and Brent -- continues to narrow, averaging $13.49 for the week and tightening by about $1 / barrel over the last month. Based on recent trends, expect the Urals discount to continue to decline by around $0.04 / day. 

The ESPO discount -- the difference between Russia's eastern oil export price and Brent -- also continues to narrow, now under $5 / barrel.  The ESPO discount may be expected to disappear entirely during the first quarter of next year.  

Bloomberg reports that Russia's seaborne crude exports averaged 3.7 mbpd last week, higher than the pre-war level and inconsistent with Russian promises to cut production.  Nevertheless, according to Reuters, Russia's energy ministry said on Friday that crude oil and petroleum products exports collectively are slated to fall in November by more than 300,000 barrels per day (bpd), compared to the average level in May-June.

This past week, Russia's central bank hiked a key interest rate to 15%, up from 13%.  The bank blamed higher-than-expected inflation.  Readers will recall that I indicated increases in Russia's money supply were consistent with 20% inflation.  Easy money appears to be propagating through the system, hence the rise in inflation.  The Bank has stated that it is anticipating 7% inflation for 2023.  This seems implausible.  Russia's central bank probably uses some version of the Taylor Rule, which would imply inflation in the 12-14% range for a 15% interest rate.  At a guess, Russia's true inflation rate is twice the figure claimed by the central bank.

Ordinarily, high inflation should lead to currency devaluation, but in fact, the ruble has appreciated by 8% on the US dollar in just the last few weeks.  This is in part due to rising Russian interest rates, but also attributable to the collapse of the Price Cap and Russia's blended oil export price holding near $80 / barrel.  Thus, Russia faces disparate trends, with elevated domestic inflation contrasting with substantially improving terms of trade internationally.  I had stated earlier that I thought late summer hype about a collapsing ruble was likely overstated, and so it proved.  Should Brent resume its rise, expect the ruble to appreciate further.

Finally, a newly released Gallup poll shows ebbing support for Ukraine in the US.  A majority still supports Ukraine, but clearly, disappointment with a lack of material progress during the summer campaign has taken the wind out of the public's sails.  Kyiv needs a rethink on financial and messaging strategy, and right now, the surreal passivity of the Ukrainian bureaucracy and Zelenskyy's inner circle is impeding action on these fronts.

Rigs and Spreads Nov. 3: The light in the tunnel was a train after all

  • After three weeks of modest gains, rig counts have resumed their decline, giving back all their gains in just this past week

  • Rig counts

    • Total oil rig counts: -8 to 496

    • Horizontal oil rig counts: -8 to 443

    • The Permian horizontal oil rig count: -4

    • The Canadian horizontal oil rig count saw progress this week, +1 to 120, but still is 16 below this week last year

  • The US horizontal oil rig count is falling at a pace of -0.5 / week on a 4 wma basis.

    • This number has been negative for 46 of the last 48 weeks

  • Frac spreads fell, -5 to 270  

    • As last week, there is a stark mismatch between rigs and spreads, with DUC inventory, as measured in days of turnover, falling to a nine-year low of 13.6 weeks

  • The rig / spread relationship remains highly unstable

    • To attain stability in the DUC count, rigs must either rise by 83 or spreads must fall by 42.  

    • Given that rig counts are falling at an implied WTI price above $90 / barrel, a rapid roll-off of spreads seems likely at some point

  • Interestingly, the Brent Spread (Brent – WTI) opened back up to $4+ / barrel in the last two weeks

    • An open spread has implied US production growing faster than Brent zone production, compelling US operators to offer a modest discount to place incremental barrels in the market

    • Historically, this spread is associated with US production growth around 400 – 600 kbpd / year

    • If that remains true, then EIA pessimism on US short-term C+C growth is misplaced

Rigs and Spreads Oct. 27: A Clear Trough


A clear trough has emerged, and rig counts are rising, if slowly

  • Rig counts

    • Total oil rig counts: +2 to 504

    • Horizontal oil rig counts: +2 to 451

    • The Permian horizontal oil rig count: +2

    • The Canadian horizontal oil rig count saw progress this week, +1 to 119, but still 19 below this week last year

  • The US horizontal oil rig count is rising at a pace of +1.0 / week on a 4 wma basis.

    • This number is positive for the first time in 48 weeks

  • Frac spreads rose, +6 to 275  

    • Even more than last week, there is a stark mismatch between rigs and spreads now, with DUC inventory, as measured in days of turnovers, falling to a nine-year low of 13.9 weeks

    • The rig/spread relationship is even more unstable than I noted last week.  To attain stability in the DUC count, rigs must either rise by 84 or spreads must fall by 43.  

  • If the breakeven to add rigs of $83 holds, then we should see appreciable rig additions in the coming weeks.

    • On the other hand, if rig counts fail to show material signs of life (cc +4 hz rigs per week), then we may be seeing the last hurrah of the US shale sector, with operators running down DUC inventories like an alcoholic taking a last drink before entering rehab.  

Rigs and Spreads Oct. 20: Reaching a bottom?

Rigs counts once again saw a glimmer of hope this week.

  • Rig counts

    • Total oil rig counts: +1 to 502

    • Horizontal oil rig counts: +0 to 449

    • The Permian horizontal oil rig count: +1

    • The Canadian horizontal oil rig count saw a solid progress this week, +4 to 118, but is still 17 below this week last year

  • The US horizontal oil rig count is falling at a pace of -0.5 / week on a 4 wma basis.

    • This number has been negative for 46 of the last 47 weeks

    • If the rig count change is zero or higher next week, then the 4 wma change in rig counts will turn positive for the first time in 11 months

  • Frac spreads rose, +6 to 269  

    • There is a stark mismatch between rigs and spreads now, with DUC inventory, as measured in days of turnovers, falling to 14.3 weeks.  This the lowest since the early days of the shale revolution

    • The rig/spread relationship is now clearly unstable

      • To attain stability in the DUC count, rigs must either rise by 75 or spreads must fall by 38.  This is the most distorted this number has been since the height of the pandemic.

      • If the breakeven to add rigs of $83 holds, then we should see appreciable rig additions in the coming weeks.

      • On the other hand, we have only two weeks of positive data on rigs, which could easily prove a false dawn.  If that’s the case, then at some point, spreads will start to fall off dramatically

  • The EIA issued the October DPR this past week

    • In the October report, September crude and condensate production from key shale plays fell to 9.47 mbpd, down 34 kbpd from August.

    • However, total August C+C shale production was revised up a whopping 237 kbpd, and the May-August period was revised up by an eye-popping 182 kbpd on average

    • Having said that, revisions have been so large lately that my confidence in reported numbers is at a low at present.  

    • As I noted last week, the EIA has been on a revision spree lately – which happens sometimes – but it does make the data hard to interpret, and reliable month-to-month comparability may not be restored until early next year.


Rigs and Spreads Oct. 20,pdf

Urals rebounds; renewed emphasis on Cap enforcement; Gaza partition

Oil Prices

Brent was choppy last week, partially recovering from the prior week's sell-off.  At writing, Brent was trading at $90 / barrel.  The Biden administration, as reported by Reuters, announced sanctions on owners of tankers carrying Russian oil priced above the G7's price cap of $60 a barrel, one in Turkey and one in the United Arab Emirates.  Brent promptly soared by $5 / barrel.  

Urals is holding near $76, $16 above the Cap.   ESPO, Russia's principal eastern oil export price, was last reported at $86.  

The Urals discount, the difference between Russia's western crude oil export price and Brent, opened back up to $14, as we had expected.

The EIA reports Russian oil production for September largely unchanged around 10.5 mbpd, 0.8 mbpd lower than its pre-war level.  No further declines are expected.

S&P Global estimates that Russia's seaborne crude oil exports are largely unchanged since the start of the war, and up a bit in September.  China and India remain key buyers.

S&P Global has also made estimates of Russia's seaborne crude exports by type of carrier and pricing regime.  The results are somewhat surprising.  Only 57% of Russia' seaborn crude exports fall into the Urals pricing zone.  A hefty 43% of exports are to the east and, to appearances, not subject to the Price Cap, whether carried on western or non-western tankers.  Of Russia's western Urals trade, only 54% is carried on western tankers, that is, those subject to the Price Cap.  Overall, only 31% of Russia's seaborne crude trade is both subject to the Urals price and carried by western tankers.  That is, only one-third of Russia's seaborne crude exports are subject to the Price Cap, although this expands to 45% if all eastern trade carried by western tankers, is included.  

At this point, therefore, we can claim that the Price Cap mechanism is riddled with holes, even assuming that the Price Cap were enforced and effective on the Urals trade carried on western tankers.  Readers know that I have been harshly critical of the Price Cap, even months before it was implemented.  We now have an additional reason: the Biden administration's analytics (including those of the Fed and Treasury) were weak.  This, coupled with a technically deficient structuring of the Cap, has led to enforcement better described as nominal than substantive.

Hamas, Israel, and the Partition of Gaza

The majority of Ukraine watchers have weighed in on events in Gaza.  I will take similar liberties.

The press and media commentators continue to refer to Hamas militants as terrorists, and certainly, the description is apt.  Nevertheless, an invasion of 1,000 Hamas fighters killing more than one thousand Israelis is not a terrorist act.  It is an act of war. The term 'terrorist' creates the impression that Hamas fighters were somehow an extremist, splinter group, acting without the approval or support of Gaza's government and against the will of Gaza's population.  This is untrue.  The attack was planned by Hamas and justified by its military chief, Mohammed Deif, as a response to "Zionist colonial occupation".  The assault on Israel was a policy decision of and implemented by the government of the Gaza Strip.

The degree of public support in Gaza is a more nuanced question.  Hamas won Palestinian elections in January 2006, and no open elections for the government of the Gaza Strip have been held since.  Hamas remains in charge.  Palestinian opinion polling from this past summer suggests that Hamas would have won an election there prior to the attack on Israel.  Nevertheless, a Washington Institute poll from July 2023 concludes that, while a "majority of Gazans (65%) did think it likely that there would be “a large military conflict between Israel and Hamas in Gaza” this year, a similar percentage (62%) supported Hamas maintaining a ceasefire with Israel."  Did the Palestinians in Gaza support the attack on Israel?  Condemnation by Palestinians of the attack on Israel has been muted to non-existent.  The polling data suggests that many Gazans support violent confrontation, but perhaps not a majority.  Reuters reports that US Secretary of State Blinken said he knew that Hamas did not represent the Palestinian people or their legitimate aspirations.  The polls say otherwise.

A terrorist act that kills a dozen victims will prompt a limited response, for example, the targeting of leadership with precision airstrikes or commando raids to free hostages.  The murder of one thousand civilians falls into an entirely different category.  The US treated the 9/11 attacks, which killed 3,000, as acts of war and invaded and conquered two countries as a result.  The 1,400 Israeli victims would represent nearly 50,000 deaths in the US, adjusted for population.  Like the US after 9/11, Israel will treat the recent attacks as acts of war by the government and people of Gaza, not merely one-off acts of terrorism by lone-wolf extremists.  

Unlike the US, which invaded Afghanistan and Iraq purely as disciplinary measures without the intent to take land, Israel will take land over punishment.  Israel cannot invade the Gaza Strip and govern it as the US did Iraq and Afghanistan.  In Gaza's dense, urban environment, the risks and complications are unpalatable.  Instead, both opportunity and necessity drive Israel to take territory.  By attacking Israel on such a large scale, Hamas has opened the door for Israel to seize land which conservative Israelis consider organic to greater Israel.  Such an opportunity may occur only once or twice in a century, and it may not be wasted.  Further, Israel's failure to detect and counteract the Hamas incursion represents a catastrophic failure of leadership.  By any reasonable measure, Prime Minister Benjamin Netanyahu's career should be finished.  His only saving grace could be the annexation of a substantial portion of the Gaza Strip.  This would make fallen Israelis not victims, but soldiers and martyrs whose blood has secured Israel's historic lands.   It may just redeem the Prime Minister's reputation.  As a political necessity, therefore, Netanyahu must seize part of Gaza.

Plans are being implemented.  The first step is to clear north Gaza, including Gaza City, of its Palestinian inhabitants.  The expulsion of the local population is well underway.  Further, every edifice in north Gaza will likely be razed to prevent talk of return, ever.  This, too, is already in process.  Finally, a new border must be designated, and one has been: the Besor Stream in the Wadi Gaza, about halfway down the Strip.  If north Gaza is cleared of its Palestinian population, its structures destroyed and the rubble cleared; and if only Israeli Defense Forces remain beyond the wall to be constructed north of the Wadi Gaza Reserve, then Israel will have annexed half of Gaza as a practical matter.   

Source: ABC News

One can only wonder at the sheer stupidity of Hamas.  Their plans for the first day of the war are clear.  What did they expect on Day 2?  Did they think that killing 1,400 Israelis would be a freebie?  Had they no notion that such an act of war would prompt Israel to seize land?  Whatever they were thinking, the reality will likely be the loss of half of the Gaza Strip to the State of Israel.

For just this reason, President Biden would do well to refrain from visiting Israel just now.  If the Hamas attack on Israel resembles 9/11, the Israeli response will constitute another Nakba (catastrophe), the destruction of the Palestinian society and homeland in 1948, and the permanent displacement of a majority of the Palestinian Arabs.  The seizure of north Gaza by the Israelis will pass into the Palestinian and Arab narrative of historical victimhood as yet another act of merciless aggression by Israel, and so it will be. Nevertheless, the attack on Israel creates both the opportunity and necessity.  President Biden's presence there will imply US endorsement of what is to come and may stain America's reputation for decades.  The President should stay away from Israel until the worst has passed.

Rigs and Spreads Oct. 13: Best week for rigs since last November

Rigs and Spreads

  • Rigs counts saw their best week since last November

    • Total oil rig counts: +4 to 501

    • Horizontal oil rig counts: +4 to 449

    • The Permian horizontal oil rig count: +1

    • The Canadian horizontal oil rig count saw a bit of life this week, +8 to 114, but still 26 below this week last year

  • The US horizontal oil rig count is falling at a pace of -2.5 / week on a 4 wma basis.

    • This number has been negative for 45 of the last 46 weeks

  • Frac spreads rose, +3 to 263  

    • As earlier, this is still too high for the current rig count, as DUCs continue to fall.  

    • To hold DUCs steady, the spread count must fall by 27

US Crude and Condensate Production Revisions

  • The most interesting news this week was EIA revisions to US crude and condensate production.in both the monthly STEO and weekly PSR 

    • US crude and condensate (C+C) production has been revised up 400 kbpd in the October STEO.

    • This changes the production narrative, as it shows almost unbroken growth from Jan. 2022 to Sept. 2023, with growth averaging about 1 mbpd / year despite falling rigs counts since last December

Since August 2022, a gap had appeared between US C+C production as reported in the weekly PSR and the monthly STEO (bottom graph).

  • As a result of this gap and the upward revision per the monthly STEO, the weekly C+C numbers have been revised up 1 mbpd in the last two months, bringing the PSR and STEO C+C numbers back into alignment (red circle, graph below)

  • This is a very large revision, but sometimes that's how it goes.  It does make the data harder to interpret.

The latest STEO (top graph) also shows US C+C production peaking last month.

  • Given the strength of trend to that point, a near term decline would seem less likely

  • Therefore, an upward revision of Q4 C+C numbers seems quite plausible

  • On the whole, however, the EIA sees US production peaking, which seems probable given on-going declines in rig counts, but timing is uncertain.

Rigs and Spreads Oct. 6: The Permian leads down

  • The Permian led rig declines this week.

  • Rig counts

    • Total oil rig counts: -5 to 497

    • Horizontal oil rig counts: -2 to 445

    • The Permian horizontal oil rig count: -2

    • The Canadian horizontal oil rig count had a bad week, down 8 to 106 and 33 below last year for the week

  • The US horizontal oil rig count is falling at a pace of -3.5 / week on a 4 wma basis.

    • This number has been negative for 44 of the last 45 weeks

  • Frac spreads rose, +5 to 260  

  • As earlier, this is still too high for the current rig count, as DUCs continue to fall.  

    • To hold DUCs steady, the spread count must fall by 26

  • Exxon is reportedly making an offer for shale leader Pioneer

    • The absorption of Pioneer into an established player like Exxon would once again mark the end of the shale revolution

Urals to $70, Ruble to 100 in Market Panic

Oil markets saw a big sell-off this past week.  Brent dropped by nearly $10 / barrel on high interest rates and Wednesday's Department of Energy (EIA) report showing US gasoline consumption collapsing, leading to a panic over the possibility of a global recession.  Pencil one in, but probably not yet.  US employment remains strong, and both diesel and jet fuel demand in the US are robust.  Oil prices merited a reset after nearly three months of secular gains, and while they may retreat a bit more from current levels, Brent and Urals should begin to climb again as sentiment stabilizes.

For the moment, however, Russian oil prices have followed Brent down with a $10 / barrel decline.  We estimate Urals closed the week around $70, with hard data available only through Wednesday.  

The Urals discount narrowed this week to under $12 / barrel, but the number is probably an artefact resulting from delays in reporting Russian oil prices.  Figure a $14 - $16 / barrel discount re-emerging when Brent stabilizes.

The ruble once again fell to more than 100 / USD, closing the week at 100.4 rubles / USD.  Investors typically flee to the US dollar during panics, and therefore one should avoid reading too much into the current ruble exchange rate.  Assuming capital markets regain their composure, the ruble might crawl back to the 96-98 / USD range over the next week or so.

Overall, the week was marked by panic in markets and chaos in the US Congress, prompting fears of funding gaps for Ukraine.  I will refrain from lecturing about funding shortfalls and the Price Cap this week.  Instead, I refer my readers to the pace at which Ukrainians are destroying Russian equipment.  Assuming Ukraine Defense Ministry numbers are broadly accurate, the Ukrainians are eliminating Russian equipment on an industrial scale with manufacturing-line routine.  Today's numbers are all but spectacular and not too far removed from those of the last several months.