Illegal immigration could go a lot higher

The historical track record suggests illegal immigration could rise substantially over the August level.  

The conventional wisdom holds that illegal immigration has fallen due to demographics and a more prosperous Mexico under NAFTA.  No doubt some of this is true.

Notwithstanding, US wages are still 2-3x that of Mexico and 7x that of the Northern Triangle (Honduras, El Salvador and Guatemala), even after adjusting for the higher cost of living in the US.  Moreover, in one survey, a third of Mexicans stated that they would like to work in the US, and presumably that number is even higher in the Northern Triangle states.  That is a potential work force in the tens of millions.

We have contended that illegal immigration is primarily economic and driven by labor demand in the US.  Moreover, we view the Great Recession as a depression (with all the ancillary manifestations, like rising racism and nascent fascism). 

Depressions take a long time to resolve, with seven to ten years not a bad estimate.  But sooner or later the gloom lifts, and the traditional motors of the economy re-engage.  With a strengthening recovery, illegal immigration could return to levels reminiscent of pre-Recession days, that is, to 45,000-65,000 SW border apprehensions / month, 50-100% higher than the year-to-date average.  Certainly, the Latin American workforce is available and US wage incentive is in place if the labor demand materializes.

Aug App by year.png

We have consistently argued that black markets -- including those in migrant labor -- are virtually impossible to extirpate, and that it is frankly not worth trying.  Far better to take the same approach the US did with alcohol in 1933 and marijuana this decade: legalize the activity and tax it.  The migrant's decision to work in the US and the US employer's decision to hire a migrant is ultimately a business decision.  The US government should treat it as such and focus policy on insuring that the country (and its conservatives) are compensated at market rates for allowing migrants access to our labor markets.  

For both Trump and incoming Mexican president Obrador, the legalization of migrant labor could be the defining victory of their administrations.

Here they come! Border crossings surge

Apprehensions at the US Southwest border in August surged to 37,554, up 6,241 (+20%) over July and nearly 7,700 (+26%) compared to our forecast.   This represents a material change in trend, and in fact represents the highest level of apprehensions for the month since 2010. Credit the US economy.  Readers will recall that we expected a higher level of apprehensions as illegal immigrants took advantage of job opportunities in the US.  That expectation looks to be taking hold in August, and it might reasonably be expected to persist for the balance of the year.

Aug Appre.jpg

By contrast, inadmissibles, those trying to cross at official crossing points without proper documentation, have remained at more depressed levels. After the spring's surge, inadmissibles numbers declined with the administration's 'zero tolerance' policy.  Although the policy has been rescinded, inadmissibles numbers have not recovered.  In August, inadmissibles numbered 9,016, up 4% over July and 6% over long term averages, but well off a trend line based on the first four months of the year.  In aggregate, we might considered inadmissible numbers for August largely close to normal, neither much better nor worse than longer term averages.

Aug Inadd.jpg

Policy Issues associated with Marijuana Legalization

  • Supply

    • Designated regulator(s)

    • Local growing of marijuana

    • Co-mingling of legal and illegal production

    • Purchases of supply from out of state

    • Development of pharmaceutical expertise

    • Drug product variations (smoked, vaped, ingested, etc.) and their implications for use, abuse, and drug perception

    • Approval, licensing and controls over producers and retail outlets (roll of municipalities)

    • Remote delivery policy and enforcement by post or courier

    • Reporting, monitoring and enforcement

    • Implementation roll-out

  • Consumption

    • Purchase standards

    • Expected usage trends

    • Impact of product variants on usage rates and public perception

    • Marijuana tourism and illicit exports from the state

  • Health and safety impacts

    • Risks related to driving, workplace absence

    • Potency standards, regulation and enforcement

    • Product purity standards, testing, monitoring and enforcement

    • Hospital and health facility reporting requirements and implementation

    • Addiction rates

    • Relationship to alcohol (complement or substitute)

    • Marijuana as a 'gateway' drug

    • Impact on the opioid crisis (the introduction of widespread use of fentanyl in illicit drug adulteration appears to be driven in signifcant part by an attempt from cartels to replace lost marijuana smuggling revenues; some fentanyl is making its way into the marijuana supply)


  • Fiscal Impact

    • Revenues

    • Development of legal v illegal market

    • Optimal taxation

    • Financial reporting, monitoring and enforcement

  • Public Outreach and Communication

    • Public perception of marijuana

    • Management of public awareness and concerns regarding legislation and implementation

    • Health warnings - TV, packaging, etc.

    • Prohibition / permitting of local retail outlets and marijuana cultivation

  • Impact on judicial system and sentencing

    • Impact of marijuana legalization on inner city crime rates

    • Impact on hard drug trade and related violence (Hard drug smuggling is up sharply as Mexican cartels are looking to replace lost marijuana sales.  Hard drugs from Mexico are distributed through Chicago and are the key contributor of the escalating violence there).

    • Impact on courts and prison system

  • Interstate issues

    • Potency harmonization

    • Best practices sharing

    • Coordinated enforcement

    • Data sharing

PROMESA nearly killed more Puerto Ricans than Hurricane Maria

Excess Deaths in Puerto Rico from Hurricane Maria:

Reviewing the Milken Study

Steven Kopits / steven.kopits@princetonpolicy.com

In late August, the Milken Institute of Public Health at George Washington University released its long-awaited study, Ascertaining the Estimated Excess Mortality from Hurricane María in Puerto Rico (the Milken Study).  As did the Harvard-led Mortality in Puerto Rico after Hurricane Maria (MPR) study, the Milken Institute tallied the excess deaths which could be attributed to Hurricane Maria. 

We had earlier been sharply critical of the Harvard-led MPR study as materially misleading in terms of excess deaths following the storm.  We assess the Milken Study similarly to provide an independent review of this politicized topic.

We conclude that Milken’s year-end estimate of 2,098 excess deaths is supportable given certain plausible assumptions.  Our own calculation for this period yields 1,439 excess deaths as we believe that fewer people left the island and those who left were younger than does Milken.  Further, unlike Milken, we believe deaths were rising on the island due to PROMESA austerity, and therefore our expectations of baseline deaths were higher, and excess deaths from the hurricane were thus correspondingly lower. 

Unlike Milken, we are unable to identify any excess deaths on the island in January-February of this year, and thus believe Milken’s Sept. 2017 – Feb. 2018 excess death count is twice that of a more plausible estimate.

PR1.jpg

Deaths

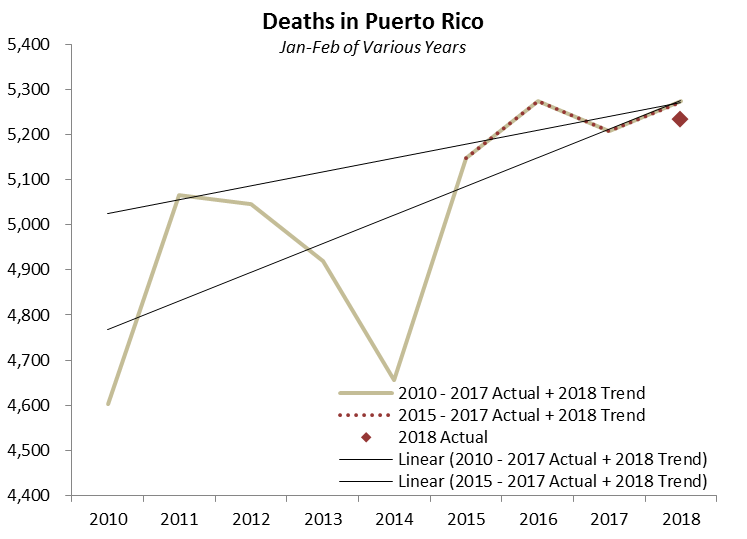
Deaths in Puerto Rico tell a curious story.  From 2010 to 2015, deaths were falling at a pace of about 175 per year.  That trend turned around, however, in 2015.  Since then, deaths have been rising at the pace of about 1300 per year.  Which trend should we use for establishing baseline expectations?

We believe the more recent trend is more compelling.  Why? Because Puerto Rico hit a fiscal wall when it defaulted on its loans in 2015.  This upended public services on the island.  Indeed, the Obama administration in October of that year urged Congress to devise a plan for Puerto Rico's massive debt in order to avoid a humanitarian crisis.  The subsequent mortality numbers give an idea of what a humanitarian crisis might look like.  For example, deaths in the first eight months of 2017 alone – before the hurricane – were 570 above the 2015 trough.

Source: Government of Puerto Rico, Milken Study, Princeton Policy analysis

Source: Government of Puerto Rico, Milken Study, Princeton Policy analysis

Thus, the numbers suggest that the excess deaths did not begin in Puerto Rico after the hurricane, but in fact two years earlier.  Cuts in spending were implemented from 2016 at the behest of the Federal government’s Fiscal Control Board, which oversees fiscal matters in Puerto Rico under bankruptcy.  To all appearances, cuts in healthcare budgets led to markedly increased mortality. 

If we thus use the post-bankruptcy 2015-2017 linear trend as the basis for our expectations and project the first eight months of 2017 onto the balance of the year, then we would have expected 29,939 deaths for the year as a whole barring Hurricane Maria.  As it was, deaths came in at 30,917,  representing 1,218 excess deaths for 2017 as a whole (after adjusting for an undershoot in the first eight months of the year).

By contrast, if we look at the Jan.-Feb. 2018 period, excess deaths are hard to find.  A linear regression based on either the 2010-2017 or the 2015-2017 actuals yields essentially the same number of expected deaths, around 5,272 for the two month period.  The observed number of deaths totaled 5,233, about 39 less than expected.  It is hard to conceive of an approach which would reach a much higher number of excess deaths for this particular period.

Source: Government of Puerto Rico, Milken

Source: Government of Puerto Rico, Milken

Thus, before counting those who left the island, we calculate the number of excess deaths for the Sept. – Dec. 2017 period at 1,218, and 1,179 for the full Sept. 2017 – Feb. 2018 period. 

Deaths adjusted for Puerto Ricans fleeing the hurricane

Milken argues that mortality needs to be adjusted for those who left the island but would have died had they remained.  This is a bit like counting those who escaped a burning building as having died from a statistical point of view, but it is not entirely without merit in attributing deaths to the hurricane.

How many people left the island due to the hurricane?  Air departures provide a good metric.

Puerto Rico lies 1,000 miles southeast of Florida.  As a practical matter, people enter and leave the island by air.  A ticket for the two-and-a-half hour flight from San Juan to Miami can be purchased for a mere $132 one way on Jet Blue (albeit the ticket was vastly more expensive in the immediate aftermath of the hurricane).  The alternative would be departure by boat, which would be highly impractical for any at-risk person, for example, one with a heart condition or requiring dialysis.  Therefore, we can anticipate that virtually all those Puerto Ricans fleeing from the hurricane did so on commercial airlines, primarily to the US.

The number of net departures from Puerto Rico is readily available from Bureau of Transportation Statistics data.  Departures have exceeded arrivals on the island for many years.  Before Puerto Rico’s financial crisis, about 45,000 people emigrated annually.  From 2014, net departures jumped to 84,000 per year.  Interestingly, net departures in 2017 before the hurricane had fallen back to levels more typical for the island. 

As Milken contends, the data does indeed show an abnormal exodus from the island.  For 2017 as a whole, 281,000 people left the island.  This trend reversed in early 2018, with about 75,000 returning through February.  

Source: Bureau of Transportation Statistics for San Juan, Aguadilla, and Ponce Airports.

Source: Bureau of Transportation Statistics for San Juan, Aguadilla, and Ponce Airports.

For our purposes, we are concerned with those who left directly as a result of the hurricane, as that relates to the counter-factual.  By early September last year, hurricanes Harvey and Irma had already pounded Houston and Florida respectively.  Those who left the Puerto Rico in early September may have done so in anticipation of a similar blow to the island.  Therefore, departures due to Maria are reasonably estimated to start from the beginning of September.

On the graph below, we can see cumulative net departures from September.  These peaked at 212,000 in December, before reversing early in 2018 and settling at 130,000 at the end of February.  Of course, the counter-factual involves an adjustment for those who would have traveled even without a storm.  To make this adjustment, we can use either the previous year or the previous decade average, which yield essentially similar numbers.  Subtracting out net departures from earlier years yields a slightly higher peak value, 218,000 net departures to December, and 136,000 at the end of February, which is coincidentally also the average for the post-hurricane period.

Source: Bureau of Transportation Statistics for San Juan, Aguadilla, and Ponce Airports.

Source: Bureau of Transportation Statistics for San Juan, Aguadilla, and Ponce Airports.

By contrast, the Milken Study estimates a population reduction by approximately 8%, or 280,000 persons from September to February, about 276,000 if adjusted for the surfeit of deaths over births during this period.

Based on the data available to us, the Milken Study looks high by a factor of two.  It is not clear how Milken’s incremental 140,000 decamped Puerto Ricans actually escaped the island.  We believe a better estimate is the 136,000 incremental Puerto Ricans who, based on air travel records, were absent from the island on average during the Sept. 2017 – Feb. 2018 period.

Demographics of those leaving Puerto Rico

Milken’s assumptions about the age groups of Puerto Ricans who left the island after Hurricane Maria are not made explicit.  The default expectation could be that PR residents left pro rata to their share in the population. 

Nevertheless, this is not the historical precedent.  Although the total population of the island declined by 446,000 in the decade to year-end 2017, the age cohort trends were quite varied.  Almost half the decline came from children under 15, and the remainder from the 15-64 age group.  The 65+ age group actually grew during the decade, up 34,000, with the senior cohort’s average age also rising.  This is no different than population trends in, for example, other remote or rural areas: Young people move out; the elderly stay. 

Source: Statista

Source: Statista

Nor did this pattern appear to change in 2017.   As part of its survey, the MPR Study asked island residents about migration patterns in the previous year.  Their answers suggest that only 5% of those who left the island last year were 65 or older.  By contrast, 15% of the island’s population falls into the 65+ age group. 

Age Distribution of Persons who left and those who remained in Households in Puerto Rico, 2017Source: Mortality in Puerto Rico after Hurricane Maria

Age Distribution of Persons who left and those who remained in Households in Puerto Rico, 2017

Source: Mortality in Puerto Rico after Hurricane Maria

If we use the 5%/95% split for 65+ and all other age cohorts, then only 7,000 of the 136,000 who left the island were 65 or older, and 129,000 were in younger age groups. 

The Milken Study reports that 77% of deaths on the island after Maria were of adults 65 years and older.

If we apply this rate to 136,000 Puerto Ricans on average who were absent from the island during the Sept.-Feb. period due to the storm, then 346 additional persons would have died had they stayed on the island through February 2018, with about half of these 65 or older. 

Using these numbers, we can begin to assemble a complete view of excess deaths on Puerto Rico and of Puerto Ricans on the island as of Sept. 1, 2017. 

PR1.jpg

Whereas Milken sees about 2,100 excess deaths during the Sept.-Dec. 2017 period, we see only 1,440, which if one used slightly different approachs could be +/- 200. For the Sept.-Feb. period as a whole, Milken sees nearly 3,000 excess deaths, whereas we estimate a much lower 1,525.   Milken’s Sept.-Dec. estimates could be plausible if one assumed long-term trends in deaths were the right measure, rather than the 2015-2017 post-bankruptcy trend which we feel is more appropriate.  Furthermore, one could generate a greater number of deaths from decamped Puerto Ricans if one assumed that a greater portion of elderly fled to the US to avoid the hurricane.

In the end, the Milken death estimates for year-end look a bit high, but not inconceivable.  On the other hand, Milken’s Jan-Feb. estimates feel quite wide of the mark, given that 75,000 islanders returned from the US at that time.  If an excess 900 people died during that two month period, it is unlikely so many would have returned, for it speaks to living conditions no better than during the immediate aftermath of the hurricane, despite the fact that 75% of the island had power on average during the January-February period.  Further, no plausible linear regression can put death counts in Milken’s ballpark for 2018.  Thus, Milken’s excess death estimates through Feb. 2018 look twice as high as a more plausible scenario.

The Bigger Picture

Whether 1400 or 2100 people died as a consequence of Hurricane Maria is, to an extent, a debate in semantics.  A large number of people died prematurely due principally to a loss of power.

The extent to which this could have been avoided is an interesting question.  We can compare the restoration of power to Puerto Rico and the Virgin Islands, the latter slammed by both Maria and Irma. 

Despite all the problems with PREPA and logistics, power was actually restored on Puerto Rico faster than on the Virgin Islands through the end of the year.  Thereafter, Puerto Rico lagged, but during the stages of elevated mortality, Puerto Rico was in no worse shape than the Virgin Islands, suggesting that logistics and geography were principally responsible for the delay in restoring power, at least through year-end. 

Source: Various press reports, Princeton Policy analysis

Source: Various press reports, Princeton Policy analysis

The hope of quickly rebuilding a power grid in the event of a hurricane is probably too optimistic.  The separate experiences of Puerto Rico and the Virgin Islands suggest that restoring power to even half the population can take four months, and about six months to complete the job.

Rather, efforts should be geared towards identifying and protecting those at risk, which the Milken Study indicates are men 65 or older most likely with serious pre-existing conditions.  Policy should be geared to evacuating this group quickly from the island, gathering them in central locations with emergency power, or keeping a store of up to 1,000 portable generators to provide home power to this cohort.  The cost of appropriate portable generators and three months of fuel, for example, comes out around $25 million – a drop in the bucket considering grid repair costs otherwise.  In any event, reliance on grid resilience for islands exposed to full force hurricanes is almost certainly misplaced.

*****

Causes of Excess Mortality

The media and research institutions have focused heavily on the impact of Hurricane Maria on Puerto Rican mortality.  This is understandable, but the data suggest Maria was just another nail in the coffin of Puerto Rico’s viability.  Our analysis suggests that, just as the Obama administration warned, cuts to public services have indeed created a humanitarian crisis in Puerto Rico.  Deaths did not start to rise with Maria.  They started to rise in 2016, the year after Puerto Rico declared bankruptcy and the Congressionally-appointed Fiscal Control Board implemented major cutbacks in the island’s social safety net.  To appearances, these cutbacks led to an increase in mortality – exactly the humanitarian crisis which was predicted.  We estimate the excess deaths from PROMESA cuts in 2016 and 2017 at 1,050 to 1,300 depending on the approach used. This is not much less than the 1440 we attribute to Hurricane Maria.

Source: Government of Puerto Rico, Milken Institute, Princeton Policy estimates

Source: Government of Puerto Rico, Milken Institute, Princeton Policy estimates

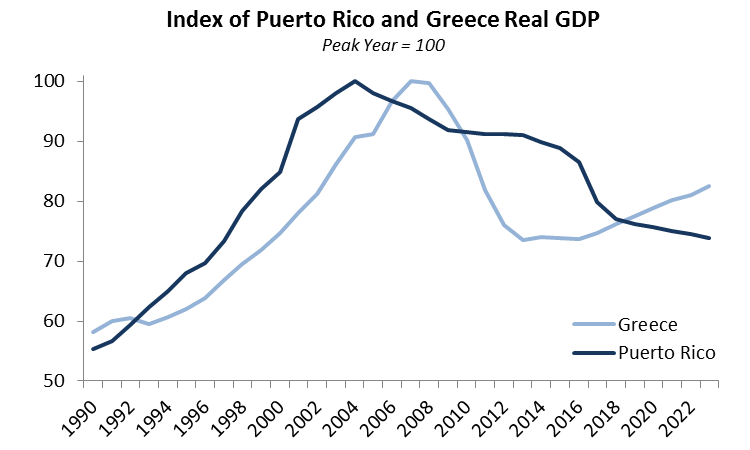
With more austerity coming, Puerto Rico’s prospects remain bleak.  This year, Puerto Rico’s cumulative economic performance since the start of the Great Recession will be worse than that of Greece.  Whereas Greece is recovering, the IMF expects Puerto Rico’s GDP to continue to fall as far as they eye can see.  By 2023, Puerto Rico’s GDP is expected to be less than three-quarters of its 2004 peak.

Source: IMF April 2018 WEO

Source: IMF April 2018 WEO

Hurricane Maria is thus but one chapter in two decades of Puerto Rican misery.  Of course, a clear accounting of mortality from the hurricane is important.  But we should not lose sight of the bigger picture, that the island is besieged from many sides, and Hurricane Maria is just a particularly bad chapter in a longer story of suffering and decline.

Puerto Rico Excess Mortality.xls

1.1 Million Cases of Migrant Victimization in 2018

Our updated analysis anticipates 1.1 million cases of predation and victimization of undocumented migrants crossing the US southwest border in 2018.

Here's the breakdown:

Princeton Policy Advisors analysis

Princeton Policy Advisors analysis

Deaths

Border Patrol typically records 300-450 deaths of illegal crossers in the desert annually.  However, when adjusted for bodies not found, bodies found by other state and local agencies, and assumed deaths on the Mexican side of the border, crossing deaths probably reach 1,000 per year.

In addition, many migrants die in the Mexican interior.  Of Mexico's 18,000 murders which can be directly attributed to US and Mexican immigration and drug policy, 10-20% are probably migrants.  Thus, an additional 1,800 - 3,600 death can be attributed to the illegal migration, bringing the aggregate total to 2,800 - 4,600 deaths.  Our best estimate puts this number around 3,000 / year, with 2,200 our 'official' estimate.  For more information, see the 'Death' tab at the linked spreadsheet.

Kidnapping and Extortion

Various third party estimates put the kidnapping and extortion of migrants in the 27,000 / year range.  The fate of those kidnapped is not entirely clear.  Many are ransomed, but what of those who are not?  They may be released, killed, or impressed to work for the cartels.  A death rate of 5% would not be particularly implausible.  In fact, given that Mexico has perhaps 40,000 unidentified remains and almost as many missing persons (some of which are surely double counted), the percentage could prove higher.  We have not made an estimate of kidnapped migrants impressed into gang service, but a number around 10,000 / year would hardly seem surprising.

Assault and Robbery

Assault numbers were below our a priori expectations, reinforcing the impression that crimes against undocumented migrants are principally economic.  By and large, criminal Mexicans do not beat up Central Americans for the fun of it.  They do it to take their money.  At shelters in central Mexico, well south of the lawless border region, 10% of those Central American migrants using the facilities reported being robbed--and that's about half way through Mexico.  By the time migrants make it through the border zone, we think it likely that 20% will have been robbed at some point along the way.

Human Trafficking

Broadly speaking, human trafficking can result from coercion, deception or as a kind of loan sharking.  Victims typically find themselves in forced labor for men, and prostitution for women.  This may result from kidnapping or deceiving an individual into an unexpected situation.  For example, women may be told that they will be taken as hotel maids, and instead be forced into prostitution and held captive there.

In addition, in some cases, migrants accept indentured servitude as compensation against an advance for coyote fees.  Such a transaction is 'voluntary', in the sense that it was the only currency the migrant could produce to pay a crossing fee.  

Rape / Coerced Sex

As part of the fees to guides (coyotes) for passage across the border, women are routinely expected to provide sexual services during the crossing.  Various sources put the estimates of coerced sex at 30-80%, with 60% the most common number.  Women constitute only 27% of those apprehended and thus presumed to attempt crossing the border.  Even so, a 60% coercion rate translates into 118,000 cases of rape or coerced sex per year.

Drug Smuggling / Extended Incarceration

If women are expected to provide sexual services as part of the coyote fee, men have traditionally been expected to carry drugs across the border.  A decade ago, this percentage was probably around 75%.  With legalization of marijuana, this number has fallen, but a precise estimate is problematic.  We think that perhaps 15% of migrant men are compelled to carry drugs today, but both a higher and lower case could be defended using reasonable assumptions.    

A migrant caught carrying 40 lbs of marijuana could face a very stiff prison term, up to 20 years.  Therefore, a key risk is extended incarceration -- which we deem as one month or more.  The US Border Patrol accepted 74,000 prosecutions in 2016, and we think 2018 will see a similar number.  To this can be added those incarcerated in US state and local prisons and in Mexican jails.  While we use 76,000 as our official estimate, the total number could be higher.  It is important to note that those incarcerated include a mixed group of migrants and professional smugglers.  Even so, the number of economic migrants incarcerated for an extended period due to immigration or drug charges probably exceeds 50,000 per year.

Border Arrests

Between the Mexican police and US Border Patrol, nearly three-quarters of undocumented migrants will be detained at some point.  This represents about half of all adverse events suffered by migrants.

Abandoned Trip

About 10% of crossers are thought to abandon their efforts en route.  This may be due to predation suffered in Mexico, for example, from being robbed or kidnapped, or fear of being arrested trying to get into the US.  This will often involve a loss of funds, including the coyote fee, representing perhaps six months of labor.  In addition, a failed entry is likely to be perceived as a personal failure or trauma by the affected individual.

Excluded Items

The above are not necessarily a comprehensive list of trauma suffered by migrants.  The following are not included:

  • Predation of Hondurans and Salvadorans crossing Guatemala
  • Miscellaneous types of harassment, price gouging and fraud
  • Some adverse events suffered by 'inadmissibles' (those trying to get through at official crossing points), including detention
  • Predation suffered by migrants already resident in the US

*****

In all, we estimate economic migrants will suffer 1.1 million traumatic or adverse event trying to reach the US in 2018.  This represents a predation rate of 144%.  That is, those 711,000 migrants attempting to cross illegally into the US this year will suffer on average 1.4 adverse events during the journey.  In a typical case, they are likely to be detained by US Border Patrol and commonly suffer another adverse event like rape or robbery.

These statistics speak to a global scale humanitarian crisis on our borders, second only to the chaos engulfing Venezuela in our hemisphere.  

US immigration policy is directly responsible for 95% of the predation listed above.  Modifying US immigration policy -- in a way which our research indicates will be supported by conservatives -- would all but end migrant predation completely.  

*****

Supporting assumptions, data and analysis are in the file below:

Migrant Predation - Sources and Methodologies (Aug. 2018)

We welcome any thoughts, questions or additional insights our readers may bring to the topic. 


SWB July Inadmissibles: Zero Tolerance deterred Asylum Seekers

Inadmissibles are those migrants who show up at official crossing points but are denied admission for lack of appropriate documentation. 

Back in April, Attorney General Jeff Sessions announced a 'zero tolerance' policy at the US southwest border, including separating parents from children.  How did this policy work out? 

If we project out the whole year based upon the first four calendar months, then we can see that in fact May-July inadmissibles came in well below forecast, 20% below for the May-July period and an impressive 33% below expectations in July alone.  A more harsh US policy motivated about 8,000 asylum seekers to defer their attempt to enter the US during the May-July period.

July Inadmissibles.png

Human and Drug Smuggling Trends under the Trump Administration

Border control issues with Mexico boil down to smuggling in marijuana, 'hard drugs', and illegal immigrants.

Attempts to enforce bans on illegal immigrants and hard drugs have materially failed under President Trump.  By contrast, the legalization and taxation of marijuana has succeeded in dramatically reducing smuggling of that drug.

Let's take these black markets in turn.

Drugs Marijuana Illegal immigrant.png

Hard Drugs

Hard drugs consist of principally of heroin, cocaine, methamphetamine and fentanyl.  Policies associated with interdicting these drugs can only be described as an abject failure, with seizures up by half since President Trump took office, compared to the prior two fiscal years.

The vast majority of hard drugs come through Customs at official crossing points.  Such contraband is almost impossible to detect, with our estimate of interdiction rates by weight around 3%.  Seizures have been rising due to both supply and demand considerations.  A strong economy brings with it demand for flashy drugs, most notably cocaine, which is rebounding in both the US and UK.  In addition, drug traffickers have been trying to compensate for the collapse of the marijuana smuggling business.  The rise of fentanyl may well be the result, as traffickers both look for new product and a way to increase the potency of their offerings at a lower cost.  The hard drug scene is likely to get worse, and possibly much worse, for the rest of this business cycle. 

Marijuana

Seizures of marijuana have dropped by nearly 60% since President Trump took office.  By any reasonable measure, this should be considered a fantastic success and trumpeted as a key accomplishment of the Administration.  Of course, declining volumes are due to marijuana legalization, most recently in Nevada, California and Canada.  Marijuana smuggling across the border is rapidly coming to an end and should cease entirely if Texas decides to legalize cannabis.  Whereas drug enforcement efforts have failed, legalize-and-tax has worked, and worked spectacularly well.

Illegal Immigration

Illegal immigrants come to the US primarily in search of higher wages.  The administration has attempted to curtail such immigration with enhanced enforcement.  Numbers were down last year, but due principally to the 'Trump effect', which intimidated migrants from attempting to cross into the US.  However, the impact has faded, and crossings have returned to more typical levels. Although enhanced enforcement has kept illegal immigration 10-15% below our expectations given the strength of the economy, such efforts have failed to move the needle in any more material way.  An enforcement-based strategy is not bringing results.

Instead we should apply our successful strategy with marijuana to illegal immigration: legalize-and-tax.  By implementing such an approach, we would effectively terminate illegal immigration and close the border by the early 2020s, without a wall or aggressive enforcement.  

No wall can stop opioid smuggling

In a Washington Times op-ed, Representative Paul Gosar of Arizona recently called for “a real defensible border to stop the flow of illegal drugs,” to prevent thousands of Americans from dying of opioid overdoses. “If we want to save lives,” he wrote, “we need a defensible border and we need it yesterday.”

Were it so simple.

Historically, marijuana has constituted more than 99% by weight of drugs smuggled into the US in the field away from official crossing points, according to US Customs and Border Patrol data.  The pictures we see of the smugglers carrying backpacks full of drugs – it’s almost entirely pot.

Notwithstanding, marijuana smuggling across the southwest border is collapsing, with seizures down 86% since 2009.  US and Canadian marijuana legalization is killing the Mexican business.  By the early to mid-2020s, marijuana smuggling across the desert will largely be consigned to the history books, whether we enforce the border or not.

What remains are ‘hard drugs’, notably cocaine, heroin, methamphetamines, and fentanyl.  Seven-eighths of all hard drugs, however, are smuggled through official crossing points, not across the open border.  Thus, a wall would do nothing to prevent the vast majority of hard drugs entering the country.  Indeed, such smuggling is booming, with interdictions up 40% since President Trump took office.

But the story is even worse than this.  The key cause of the overdose epidemic is fentanyl, a synthetic opioid 50-100 times more potent than heroin.  Drug dealers use fentanyl to spike other drugs like heroin, cocaine, and even methamphetamines.  As little as two milligrams – the equivalent of a few grains of salt – can kill the average person.   A user might believe they are receiving a normal dose of, say, heroin but inject a fentanyl-laced dose many times more powerful.  A user of cocaine or methamphetamines may not even realize the drugs have been adulterated and die without any expectation of having taken a serious risk.

The economic incentive to use fentanyl is enormous.  A soda can equivalent of fentanyl, costing one thousand dollars, could translate into counterfeit opioid pills with a street value in excess of $1 million.  That much fentanyl could easily be hidden in the bowels of a drug carrier, or readily concealed anywhere in the seven million trucks crossing from Mexico into the US this year.  Even if every person entering the southern US were given a cavity search and every crossing vehicle disassembled to its component parts, a cheap drone could still fly $20 million of fentanyl over the wall into the US every day.  There is no way to stop fentanyl at the border.  It is too compact, too potent and too valuable.  

As a result, the calls for enhanced border enforcement are in reality pleas for the status quo.  Such exhortations may make us feel better, but merely underwrite the terrible toll that opioid overdoses are taking on the country.  If we take the crack cocaine or HIV epidemics as a template, the opioid crisis could claim as many as 500,000 victims by the time it ultimately burns out a decade from now. 

The country does, however, have two other policy options: legalize hard drugs or suppress demand.

Many drug policy experts and liberal politicians are advocating for legalizing hard drugs, at least for medicinal use.  For example, New York mayor Bill de Blasio is championing supervised injection sites to allow users to check drugs for adulteration and provide a safe space to shoot up.  Based on the experience of the Netherlands, such a policy would sustain perhaps one million addicts nationally, but could reduce the death toll by more than 90%. 

Alternatively, the US could attempt to copy the approaches of Japan and Singapore.  These put addicts into forced recovery, including ‘cold turkey’ withdrawal and months in work programs.  Both of these initiatives succeeded in materially eliminating heroin and opium addiction in their respective countries, but they are not for the faint-hearted.  Nor would the program come cheap, although the cost could be largely offset by savings elsewhere in drug interdiction, incarceration and treatment.  If one wants to take a hardline conservative approach, aggressive demand suppression is the way to go.

There are no easy options in combating opioid deaths.  The public is poorly served, however, by an unthinking repetition of the build-the-wall mantra.  The fixation on the wall to stop drugs translates, as a practical matter, into an acquiescence in the death of hundreds of thousands of additional overdose victims.  It is unequivocally the wrong policy.

What conservatives want -- but won't get -- from immigration reform

Conservatives don't have the votes to maintain deportation, as we discussed here.  Nor have we ever beaten a black market, as discussed here.

Instead, here's the most likely political outcome:

The Democrats will either take the House or come close in November, and some version of the DACA and Dreamer eligible will be granted permanent or indefinite residency, in return for a promise of enhanced border protection and more aggressive ICE efforts.

As the US has never beaten a black market, it will again fail this time around as border enforcement will prove ineffective.  On the other hand, potential migrants will be encouraged by DACA / Dreamer amnesty to believe that, if they can just hang on, they or their children will in time also gain amnesty.  It sets up a replay of 1986 (with the caveat that Latin American demographics are different today than they were in, say, 1990).  The quote below, from The Atlantic in 1994, will come back to haunt conservatives once again: 

The mass legalization of then-illegal immigrants was traded for the promise that a new program of employer sanctions would destroy the incentive for further mass immigration. That hope proved vain; but if it had never been entertained, IRCA would never have passed.

In other words, conservatives were played for suckers, by a Republican White House and Senate and a Democratic House.  The graph below shows the appalling result:

Population.png

Conservative anger and xenophobia may be understandable, but in policy terms, it's the equivalent of leading with your chin.  Anger is not enough.  Conservatives also have to be smart.

Obrador's Chance to Reduce Mexico's Corruption and Violence

Only July 1st, Andrés Manuel López Obrador won the Mexican presidential election promising to eradicate corruption and quell endemic violence.

Prohibitions and resulting black markets in drugs and illegal migration are responsible for approximately 60% of the violence and corruption in Mexico.  These black markets result principally from US immigration and drug policy and Mexico's war on drugs.

Black markets are not crimes of convenience.  They are businesses, sometimes legal and sometimes not, as we have seen in the US for alcohol, marijuana and gambling, for example.  When illegal, they generate outsize profits available for bribery and recruitment of foot soldiers to intimidate and assassinate politicians, policemen, judges and journalists.  

For example, US Prohibition era gangster Al Capone once claimed that half the Chicago police force was on his payroll and reportedly spent half his $60 million in annual earnings in the 1920s on bribes for police and politicians.  The head of the DEA in Colombia during the Pablo Escobar era described the country as a 'narco-democracy' after drug traffickers contributed $6 million to the successful presidential election campaign of Ernesto Samper in 1994.  The Escobar organization turned about $20 bn in revenues in a good year, twice Colombian government tax receipts, providing ample funding to take on the national government there.  More than 500 Colombian policemen were shot pursuant to Escobar's bounty on their lives.  

With the death of Escobar in 1993 and the ratification of NAFTA in 1994, the drug business moved north to Mexico.  But the dynamics are the same.  In the just concluded election cycle, 138 politicians and campaign workers were assassinated.  Just last week in Mexico, 28 police officers in the state of Michoacan were detained over their alleged involvement in the murder of mayoral candidate Fernando Angeles Juarez. 

In the US, the homicide rate nearly doubled during Prohibition, and fell by half when Prohibition was repealed.  In Mexico, the situation is even worse, with homicides rising by 150% with the inception of the war on drugs; 2018 is on track to post a record 32,000 homicides for the year.

Mexico US homocide.png

When President Obrador calls to reduce violence and corruption, these are essentially two manifestations of a single problem: black markets.  Our purpose is not to advocate for legalizing hard drugs (although we do think Mexico should legalize marijuana along the lines of Canada and a number of US states).  Rather, our purpose is to call for legalizing and taxing migrant labor -- a proven approach to address this black market.  This would not cure all ills, but it should reduce corruption and violence by 20% or so, even in the absence of drug legalization.

Jan Brewer was right. Most illegal immigrants were carrying drugs

In 2010, then Arizona Governor Jan Brewer took some heat for saying that a majority of illegals were drug mules.  

In fact, the numbers bear her out.  We can impute the number of drug carriers through the volumes of drugs seized by Border Patrol and estimated seizure rates; as well as the number of illegal border crossers arrested and assumed apprehension rates.  In 2010, for example, Border Patrol arrested 450,000 crossers representing 1.1 million crossing attempts for the year.  

In addition, Border Patrol seized 3.4 million lbs of drugs, virtually all marijuana.  We estimate interdiction rates at 14% (12-15% range), implying smugglers tried to bring in an astounding 23 - 29 million pounds of drugs over the border away from official points of entry in 2010.

Smuggler Percent.png

The standard backpack for drug smugglers is estimated at 40 lbs, thus 23 - 29 million pounds translates into roughly 1,700 - 2,200 smuggling trips per day.  Projected onto 1.1 m crossers implies that 51-64% of all crossers carried drugs in 2010. Thus, our mean estimates suggests that more than half of illegal border crossers smuggled drugs in 2010, just as Jan Brewer claimed.

As I have noted earlier, drug volumes seized by Border Patrol have been collapsing due to marijuana legalization in the US and, just recently, Canada.  Expected 2018 seizures of marijuana are forecast down 86% from 2009 levels, which would translate into 200-250 smuggling trips per day in 2018.  I'd note that these numbers do not entirely line up with anecdotal data from rancher Jim Chilton, with whom I had the pleasure of speaking last week.  Jim runs a 55,000 acre ranch of which 15 miles constitutes the border with Mexico.  Most of the crossers coming over his property appear to be carrying backpacks presumed to be filled with drugs.  If so, seizure rates may be substantially lower than believed in our analysis (and smuggling rates correspondingly higher).   

I would also add that drug mules are a combination of professionals -- who will make return trips -- and economic migrants, who carry drugs opportunistically one-time to pay their coyote fees.  By definition, the share of economic migrants carrying drugs will be lower than the total percentage of smugglers in all crossers. Notwithstanding, our current estimates still suggest that more than half of economic migrants carried drugs in 2010, falling to about 10% in 2018.

In any event, the marijuana smuggling business across the border is likely doomed and should fall to very low levels by the early to mid-2020s.

Can illegal immigrants really afford a 25% tax rate?

Yes, they can, because they already are.

In an earlier note, we talked about the Relocation Wage, the hourly wage Mexicans would have to earn to make it worth their while to come to the US, and we calculated this around $6.50 / hour.  If border enforcement is effective, then the realized wage should be higher than this level.  If it is not, then we would expect observed wages to come in around the Relocation Wage.  Our analysis suggests that the border is largely ineffective and wages have been around the Relocation Wage, due to wage theft, poor utilization, and hassle costs (risk of deportation, inability to operate normally, etc.)

Thus, Mexicans appear to be realizing $6.50 / hour on typical US unskilled wages of $10 / hour, representing an effective tax rate of 35%.  

In a market-based system, we look to monetize theses costs in a fee to the government, which is worth about $30 bn net to the Federal budget -- but is achieved at essentially no cost to illegal immigrants as a whole.  We are simply replacing predation and dead-weight costs in a black market system with a formal fee in a legalized system.

The range of outcomes, however, is dramatically altered.  Today, the Mexicans who lose the border crossing lottery die in the desert, or are raped, kidnapped, trafficked or incarcerated.  That would end entirely, as there is no point in entering illegally if a legal channel is always available at a market rate for a volume of visas which materially cover the entire market.  

Similarly, those undocumented migrants already in the US would see much reduced wage theft and higher utilization rates (or lower costs, if they leave the US seasonally), and obviously much greater ease of living and working in the US.  

The top 10% would see some decline in net income.  On the other hand, the more successful have the most to lose from deportation and the greatest opportunity for advancement in a legal system.

I cannot over-emphasize how much this would change the image of Mexicans in the US.  There are a number of conservative radio hosts and columnists on this email list, and some of them really want the Mexicans out.  I can assure you, though, if a Mexican day laborer is paying $5,000 in visa fees for nothing more than the right to work and basic healthcare coverage, that migrant will earn the respect of even the most hardened immigration foes.  Legalization brings normalization.  Today, no one much challenges alcohol consumption, although it causes far more damage to the US than immigrants do.  We are used to it, and now to gambling and increasingly, to marijuana.  The very act of legalization changes public perceptions dramatically.